Slide 8 of 8 from Free ESG Slide Template for PowerPoint
Graphical Representation Slide – Free ESG PPT Template
ESG Summary and Impact Analysis Slide
- Chart
- Bar Horizontal
- Strategic Analysis Slide
- 16:9
- 100% Editable
What’s on This Slide
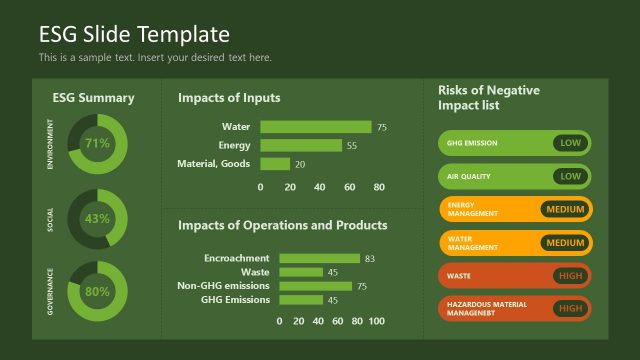
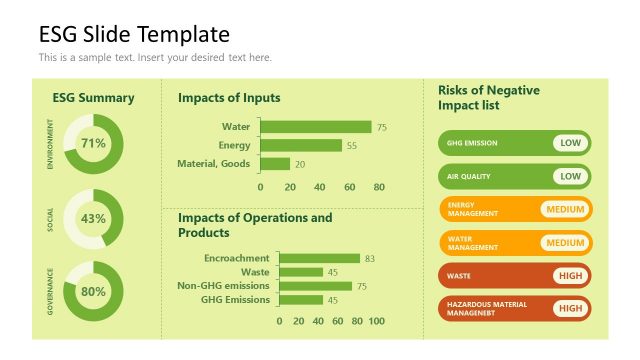
The layout features a left section displaying three circular progress indicators for ESG summary metrics, labeled Environment, Social, and Governance, with values of 71%, 43%, and 80% respectively. To the right, there are two distinct sections: one for 'Impacts of Inputs,' showing horizontal bar charts for Water, Energy, and Material Goods with values of 75, 55, and 20. Below this, another section titled 'Impacts of Operations and Products' lists metrics for Encroachment, Waste, Non-GHG emissions, and GHG emissions. The background is a dark green, enhancing visual contrast.
How to Use It
This slide serves as a comprehensive overview of ESG metrics and their impacts, making it suitable for presentations focused on sustainability assessments or corporate responsibility. It can be effectively used in discussions about environmental strategies, social governance, and operational impacts. Positioned towards the end of a presentation, it summarizes key findings and implications, facilitating a conclusion or call to action. This layout is ideal for stakeholders interested in ESG performance and risk management.
Text Placeholders & Capacity
Keep your copy within these limits so it fits without resizing. Node labels can accommodate around 5 words each.
| Placeholder | Count | Max characters (approx.) |
|---|---|---|
| Slide title | 1 | 30 |
| Item heading | 5 | 20 |
| Item body | 5 | 10 |
| Chart title | 2 | 30 |
Slide Keywords
Download unlimited PowerPoint templates, charts and graphics for your presentations with our annual plan.
DOWNLOADReturn to Free ESG Slide Template for PowerPoint.