Slide 2 of 3 from Free Dark Speedometer Shapes for PowerPoint
FF0017-01-dark-speedometer-2
Dark Speedometer Comparison Slide
- Diagram
- Comparison Split
- Evaluation Slide
- 16:9
- 100% Editable
The Speedometer Comparison Layout from the Free Dark Speedometer Shapes for PowerPoint template offers a clear visual tool for evaluating multiple KPIs simultaneously. This slide template features editable shapes and vector icons arranged to facilitate quick performance comparisons, making it suitable for business presentations and pitch deck templates that require concise status reporting. Its design supports effective communication of key metrics within a corporate presentation or slide deck environment.
What’s on This Slide
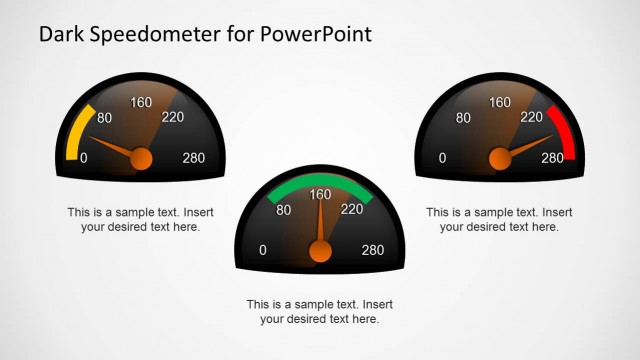
The layout features three speedometer gauges arranged horizontally. Each gauge is semi-circular, displaying a range from 0 to 280, with distinct color indicators: green, yellow, and red. Below each gauge is a rectangular text placeholder for sample text, aligned centrally. The gauges are visually separated by space, enhancing clarity. The title is positioned at the top center, providing context. The background is light, creating contrast with the dark gauges. Overall, the elements are grouped to emphasize the comparison of performance metrics.
How to Use It
This layout serves as a performance comparison tool, ideal for presenting key performance indicators across three metrics. It fits well in a presentation sequence following an overview or problem statement, leading into detailed analysis. Business scenarios include status updates, KPI dashboards, and performance reviews. Each gauge can represent different metrics, making it versatile for various reporting contexts. This layout effectively communicates comparative data at a glance, facilitating audience understanding of performance levels.
Text Placeholders & Capacity
Keep your copy within these limits so it fits without resizing. Node body slots can hold about 10 words each, tight for detail.
| Placeholder | Count | Max characters (approx.) |
|---|---|---|
| Item body | 3 | 50 |
| Slide title | 1 | 30 |
Slide Keywords
Download unlimited PowerPoint templates, charts and graphics for your presentations with our annual plan.
DOWNLOADReturn to Free Dark Speedometer Shapes for PowerPoint.