Slide 6 of 8 from Free Business Presentation Deck
Business Deck Bar Chart Slide PowerPoint
Simple Bar Chart for Business Presentation
- Chart
- Bar Vertical
- Evaluation Slide
- 16:9
- 100% Editable
What’s on This Slide
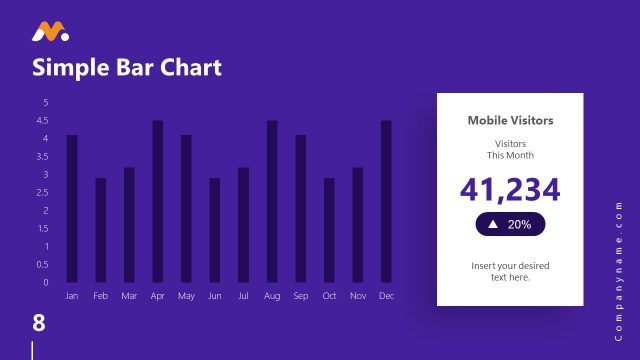
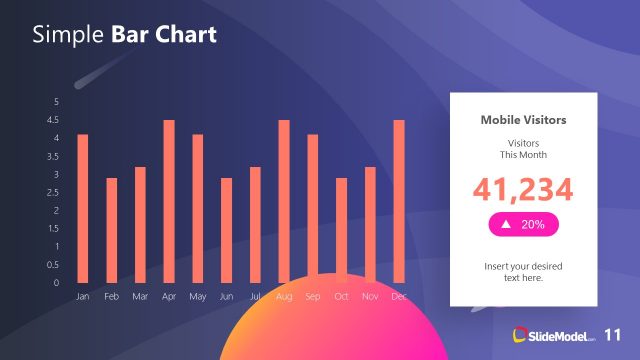
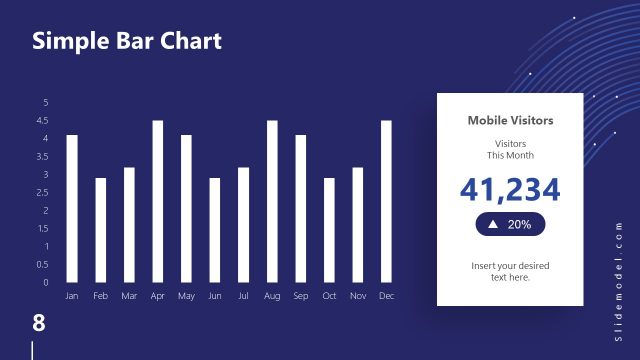
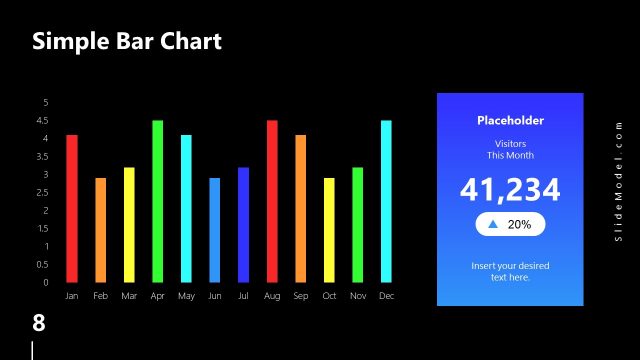
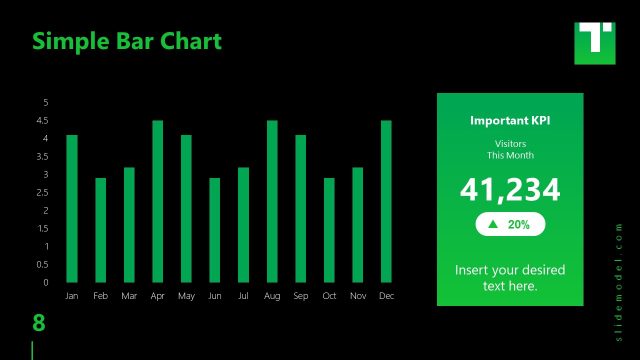
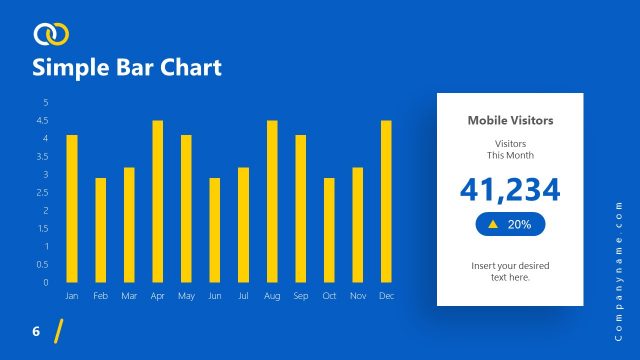
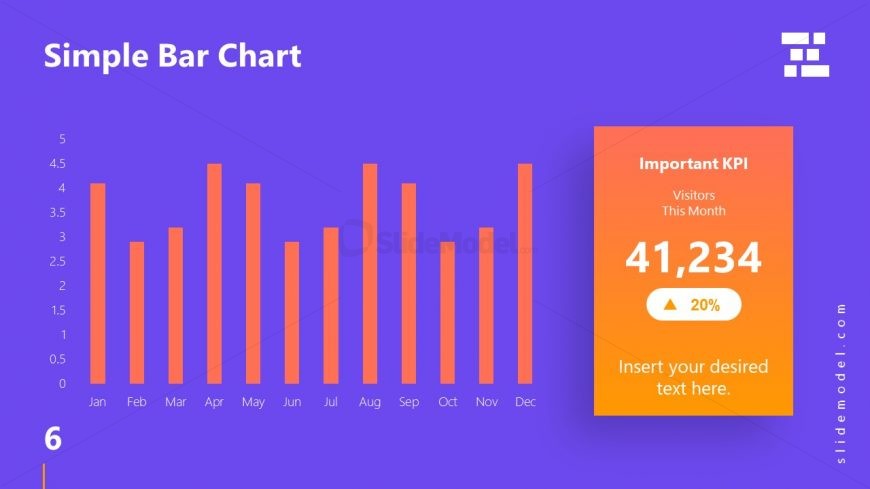
The slide features a simple bar chart on the left side, displaying monthly data from January to December. The bars are orange and vary in height, indicating different values between 0 and 5. A title at the top reads 'Simple Bar Chart.' On the right, there is a KPI box with a gradient background, labeled 'Important KPI,' showing a visitor count of 41,234 and a percentage increase of 20%. There are text placeholders for additional information, aligned within the KPI box. The background is a solid purple color, creating a clear visual hierarchy.
How to Use It
This layout serves as a data visualization tool, ideal for presenting key performance indicators alongside a bar chart. It fits well in a presentation sequence after problem identification and before strategic recommendations. This structure is useful in business scenarios such as performance reviews, marketing analysis, or sales reports, where clear data representation is essential. The slide effectively communicates trends and highlights important metrics, making it suitable for stakeholders looking for quick insights.
Text Placeholders & Capacity
Keep your copy within these limits so it fits without resizing. The title slot can hold a short phrase, while the body slot is more spacious.
| Placeholder | Count | Max characters (approx.) |
|---|---|---|
| Slide title | 1 | 20 |
| Item heading | 12 | 3 |
| Item body | 1 | 20 |
| Body paragraph | 1 | 40 |
Slide Keywords
Download unlimited PowerPoint templates, charts and graphics for your presentations with our annual plan.
DOWNLOADReturn to Free Business Presentation Deck.