Slide 8 of 8 from Free Business Analysis Infographic Shapes
Bar Char Presentation Infographic Diagram
Mountain Progress Chart for Business Analysis
- Diagram
- Other
- Evaluation Slide
- 16:9
- 100% Editable
The Mountain Progress Chart slide from the Free Business Analysis Infographic Shapes template offers a clear visual tool for illustrating performance metrics and project milestones. Designed with editable shapes and vibrant vector icons, this slide layout supports effective communication of growth trends in business presentations or pitch deck templates, making complex data accessible and engaging.
What’s on This Slide
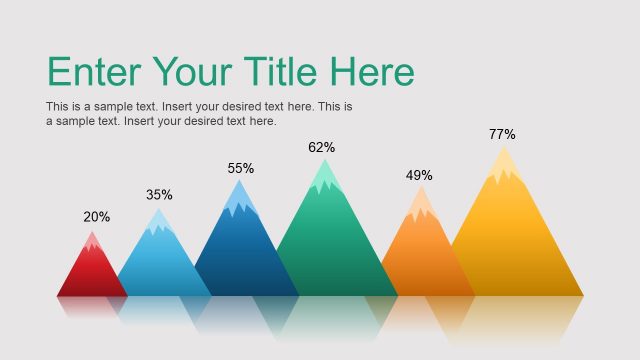
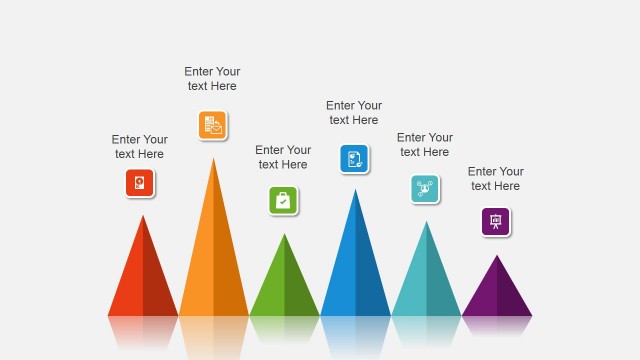
The layout features a series of five mountain shapes arranged horizontally across the bottom of the slide. Each mountain is a different color, representing various percentages labeled at their peaks. The mountains are positioned in a staggered manner, with the tallest mountain on the right and the shortest on the left. Above the mountains, there are two text placeholders: the title is centered at the top and a body text placeholder is below it, aligned centrally. The background is a light gray, providing contrast to the colorful mountains.
How to Use It
This layout serves as a visual representation of progress or performance metrics, suitable for business presentations. It can be used to illustrate growth trends, project milestones, or comparative analysis of different initiatives. Positioned at the end of a presentation, it summarizes key outcomes or achievements. This structure is effective for stakeholders needing a quick visual reference to performance data, making it ideal for status updates or project reviews.
Text Placeholders & Capacity
Keep your copy within these limits so it fits without resizing. Body text slots can hold about 20 words each.
| Placeholder | Count | Max characters (approx.) |
|---|---|---|
| Slide title | 1 | 30 |
| Body paragraph | 1 | 120 |
| Item heading | 5 | 3 |
Slide Keywords
Download unlimited PowerPoint templates, charts and graphics for your presentations with our annual plan.
DOWNLOADReturn to Free Business Analysis Infographic Shapes.