Slide 1 of 8 from Free Animated Business Infographics PowerPoint Template
Infographic Presentation Business Template
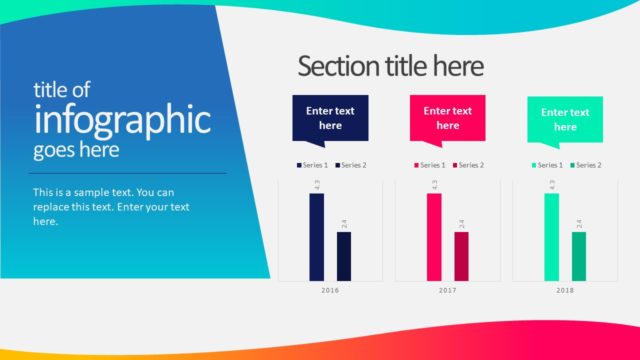
Infographic with Bar Charts for Business Data
- Chart
- Bar Vertical
- Data Findings Slide
- 16:9
- 100% Editable
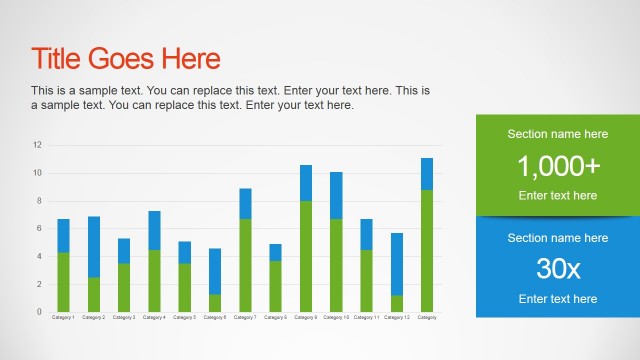
The Infographic with Bar Charts slide from the Free Animated Business Infographics PowerPoint Template offers a clear and organized layout for presenting comparative business metrics. Designed for quarterly performance reviews, financial summaries, or market analysis, this slide utilizes editable shapes and vector icons to enhance data visualization within a corporate presentation or pitch deck template.
What’s on This Slide
The slide features a dark gray background with a prominent green and white diagonal shape at the bottom. On the left, there is a large title placeholder for the infographic, followed by a sample text placeholder aligned below it. To the right, three bar charts are displayed in a vertical arrangement, each with a title placeholder above. Each chart has two series represented in distinct colors: green, blue, and yellow. Text placeholders for additional information are positioned above each chart. The overall layout emphasizes clarity and organization.
How to Use It
This layout serves as a data visualization tool, ideal for presenting comparative business metrics over multiple years. It fits well at the beginning of a presentation to introduce key data points. Suitable scenarios include quarterly performance reviews, financial summaries, or market analysis. The structured arrangement allows for easy comparison of data across different categories or time periods, making it effective for stakeholders seeking insights.
Text Placeholders & Capacity
Keep your copy within these limits so it fits without resizing. Body slots are tight, roughly 15 words each.
| Placeholder | Count | Max characters (approx.) |
|---|---|---|
| Slide title | 1 | 30 |
| Body paragraph | 1 | 100 |
| Item heading | 6 | 10 |
| Item body | 6 | 5 |
| Callout | 3 | 20 |
Slide Keywords
Download unlimited PowerPoint templates, charts and graphics for your presentations with our annual plan.
DOWNLOADReturn to Free Animated Business Infographics PowerPoint Template.