Slide 4 of 9 from Free Animated Editable Professional Infographics PowerPoint Template
3 Steps Graph Chart PowerPoint
Profitability and Time Chart Slide
- Chart
- Bubble Chart
- Evaluation Slide
- 16:9
- 100% Editable
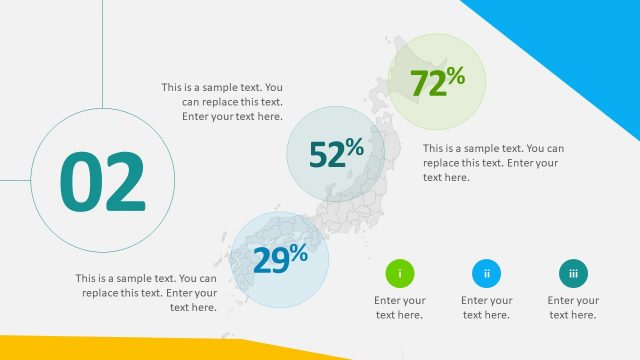
The Profitability and Time Chart slide from the Free Animated Editable Professional Infographics PowerPoint Template offers a clear visual evaluation of financial performance trends. Designed for business presentations, this slide layout uses editable shapes and vector icons to compare profitability metrics over time, making it suitable for KPI presentations and project profitability reviews within a corporate slide deck.
What’s on This Slide
The layout features a horizontal axis labeled 'Time' and a vertical axis labeled 'Profitability.' Four circular nodes are positioned at varying coordinates, each displaying a percentage value. The largest node, at the top right, shows 72%, while the others display 52%, 29%, and a placeholder for additional text. Text placeholders are aligned beneath each node, indicating where descriptive text can be added. A prominent number '02' is placed in a large circle on the left. The background includes a gradient and geometric shapes, creating a structured visual hierarchy.
How to Use It
This layout serves as a comparative analysis of profitability over time, ideal for illustrating trends or performance metrics. It fits well in a presentation sequence after a problem statement, providing a visual representation of data. This structure is useful in business scenarios such as financial reports, project assessments, or performance reviews, where stakeholders need to understand profitability dynamics. It can be used to highlight key performance indicators or benchmarks in a clear and engaging manner.
Text Placeholders & Capacity
Keep your copy within these limits so it fits without resizing. Node body slots can hold about 30 characters each, while the title slot is tight at around 10 characters.
| Placeholder | Count | Max characters (approx.) |
|---|---|---|
| Item body | 4 | 30 |
| Slide title | 1 | 10 |
Slide Keywords
Download unlimited PowerPoint templates, charts and graphics for your presentations with our annual plan.
DOWNLOADReturn to Free Animated Editable Professional Infographics PowerPoint Template.