Slide 1 of 11 from #4 3D Spherical PowerPoint Template
3D0031-advanced-3d-spherical-structure-for-powerpoint-16×9-1
3D Spherical Structure for PowerPoint
- Diagram
- Segmented Wheel
- Evaluation Slide
- 16:9
- 100% Editable
The 3D Spherical Structure slide from the #4 3D Spherical PowerPoint Template offers a clear segmented wheel diagram ideal for business presentation needs such as market analysis and resource allocation. This slide layout integrates editable shapes and vector icons to visually represent data distribution through colored segments and percentage values, enhancing clarity in pitch deck templates and corporate presentations.
What’s on This Slide
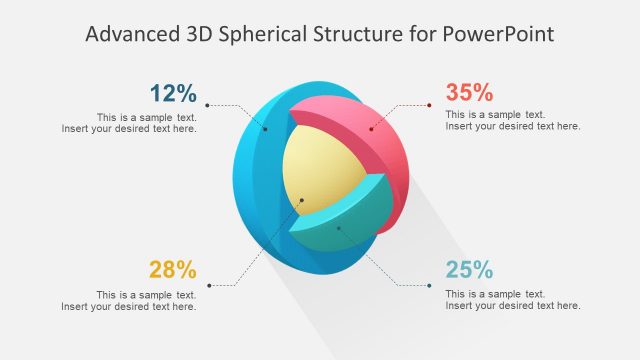
The layout features a 3D spherical diagram at the center, divided into four segments with varying colors: blue, pink, yellow, and red. Each segment displays a percentage value, positioned at the outer edges. Text placeholders are located adjacent to each percentage, indicating where to insert desired text. The title is centered at the top, while the background is light gray. The visual hierarchy emphasizes the percentages and segments, with connecting lines leading to the text placeholders. The overall composition is balanced and organized.
How to Use It
This layout serves as a visual representation of data distribution or composition, ideal for showcasing percentages or parts of a whole. It fits well in presentations that require a clear breakdown of components, such as market analysis, project status updates, or resource allocation. The structure is effective for business scenarios where visual clarity and engagement are essential, allowing for easy comparison of different segments. It is best used early in a presentation to introduce key metrics or findings.
Text Placeholders & Capacity
Keep your copy within these limits so it fits without resizing. Node labels can hold about 10 characters each, while body text can accommodate roughly 40 characters.
| Placeholder | Count | Max characters (approx.) |
|---|---|---|
| Slide title | 1 | 40 |
| Item heading | 4 | 10 |
| Item body | 4 | 40 |
Slide Keywords
Download unlimited PowerPoint templates, charts and graphics for your presentations with our annual plan.
DOWNLOADReturn to #4 3D Spherical PowerPoint Template.