Slide 8 of 8 from 3D Infographic Elements for PowerPoint
Free 6-Step 3D Circular Process Diagram Slides
Hexagonal Process Diagram for Presentations
- Diagram
- Hexagonal Process
- Process Slide
- 16:9
- 100% Editable
The Hexagonal Process Diagram slide from the 3D Infographic Elements for PowerPoint template offers a clear visual tool for process overviews and strategic planning. This slide layout uses editable shapes and vector icons to present multi-step processes with percentage data, making it suitable for business presentations and performance metric discussions within slide decks.
What’s on This Slide
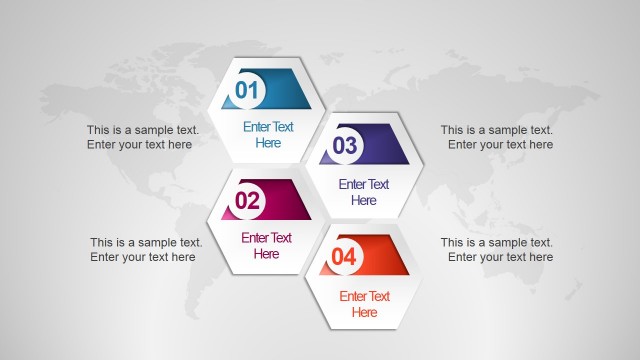
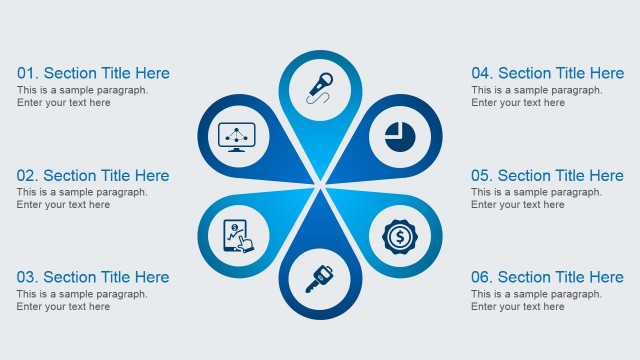
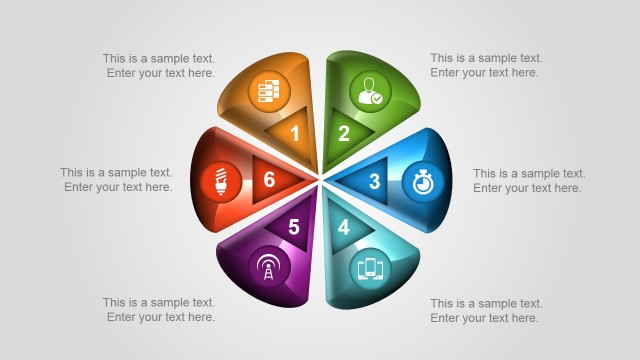
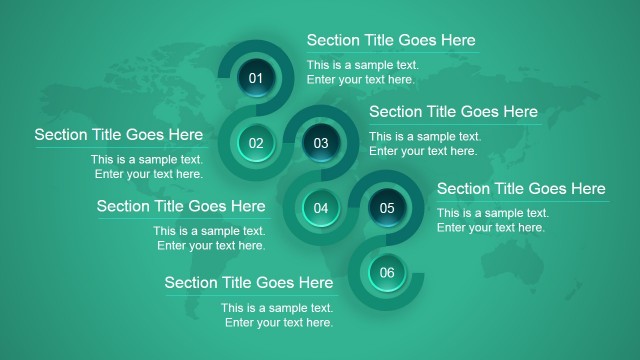
The layout features a central hexagon surrounded by six triangular segments, each labeled with a number from one to six. The hexagon contains three segments filled with varying shades of blue and gray, displaying percentages of 25%, 50%, and 75%. Each triangular segment has a title placeholder at the top and a text placeholder below, aligned centrally. The background is light gray with a subtle world map pattern, enhancing the infographic style. The overall composition is symmetrical, emphasizing the central hexagon as the focal point.
How to Use It
This layout serves as a process diagram, ideal for illustrating multi-step processes or components. It fits well in presentations that require a visual representation of data distribution or progress tracking. Suitable scenarios include project updates, performance metrics, or strategic planning discussions. The layout can effectively communicate complex information in a structured manner, allowing audiences to grasp key points quickly.
Text Placeholders & Capacity
Keep your copy within these limits so it fits without resizing. Node body slots can hold roughly 15-20 words each.
| Placeholder | Count | Max characters (approx.) |
|---|---|---|
| Item heading | 6 | 20 |
| Item body | 6 | 100 |
| Slide title | 1 | 30 |
Slide Keywords
Download unlimited PowerPoint templates, charts and graphics for your presentations with our annual plan.
DOWNLOADReturn to 3D Infographic Elements for PowerPoint.