Slide 1 of 29 from #2 Maps Bundle PowerPoint Template
maps-bundle-powerpoint-cover-image
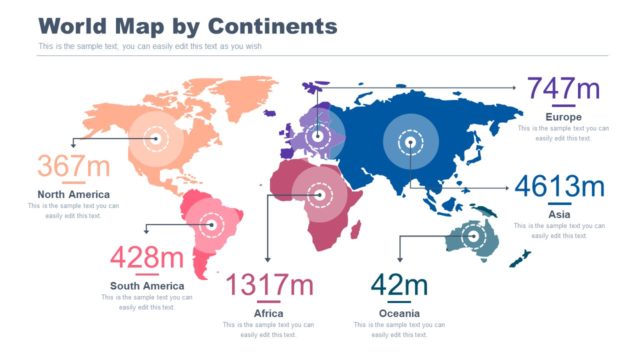
World Map Demographic Slide Overview
- Map
- World Map
- Context Slide
- 100% Editable
The World Map Demographic slide from the #2 Maps Bundle PowerPoint Template offers a clear visual tool for demographic analysis and market research. Featuring editable shapes and vector icons, it supports population statistics presentation with a central map and data-driven icons. This layout is suitable for business presentations and slide decks requiring detailed regional demographic insights.
What’s on This Slide
The layout features a world map positioned centrally, with demographic icons scattered across various regions. Each icon represents a demographic statistic, such as population percentages and monetary values. Text placeholders are located at the bottom, allowing for alignment with the map and icons. The visual hierarchy emphasizes the map, supported by icons and data points. The background is a gradient, enhancing the map's visibility. Color schemes include shades of blue and pink, creating a clear distinction between different data points and regions.
How to Use It
This layout serves as a demographic analysis tool, ideal for presentations discussing population statistics or market research. It fits well in a sequence following a problem statement, providing visual context for demographic trends. Suitable scenarios include market entry strategies, regional analysis, and demographic comparisons across countries. The structure allows for easy integration of data, making it effective for both individual and team presentations.
Text Placeholders & Capacity
Keep your copy within these limits so it fits without resizing. Body slots can accommodate roughly 20-30 words each.
| Placeholder | Count | Max characters (approx.) |
|---|---|---|
| Item heading | 5 | 20 |
| Body paragraph | 1 | 150 |
Slide Keywords
Download unlimited PowerPoint templates, charts and graphics for your presentations with our annual plan.
DOWNLOADReturn to #2 Maps Bundle PowerPoint Template.