Slide 15 of 32 from #2 Editable Data Driven Maps Bundle
Map Bundle Australia PowerPoint
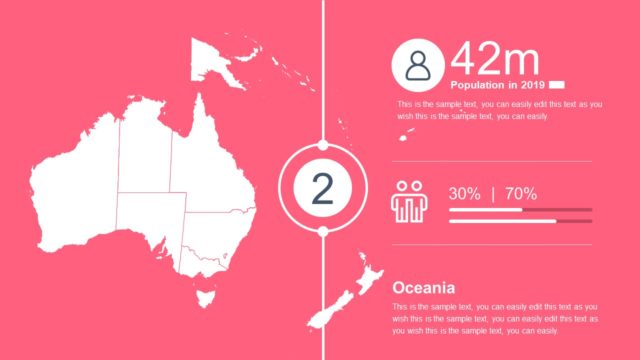
Oceania Population Overview Slide
- Map
- Country Map
- Context Slide
- 16:9
- 100% Editable
The Oceania Population Overview slide from the #2 Editable Data Driven Maps Bundle offers a clear geographic presentation of demographic statistics. Featuring a map of Oceania alongside key population data, this slide template is ideal for business presentations or demographic reports requiring editable slides that highlight regional population insights effectively.
What’s on This Slide
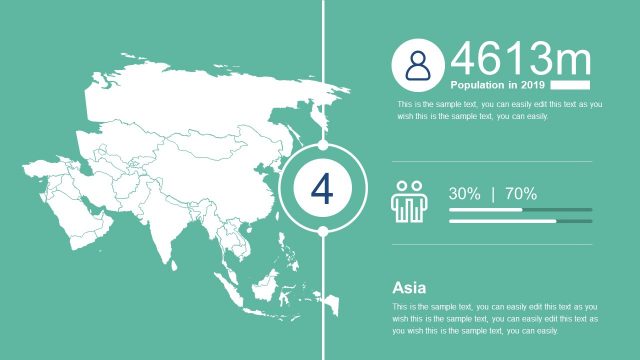
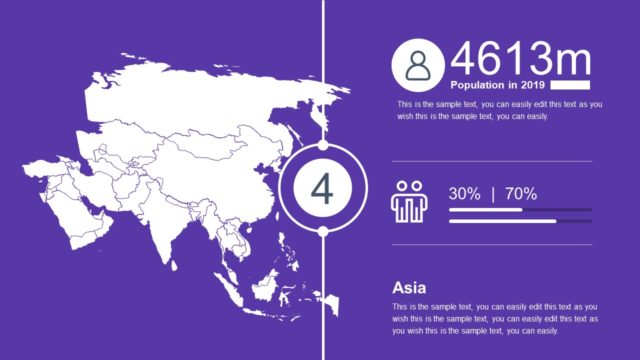
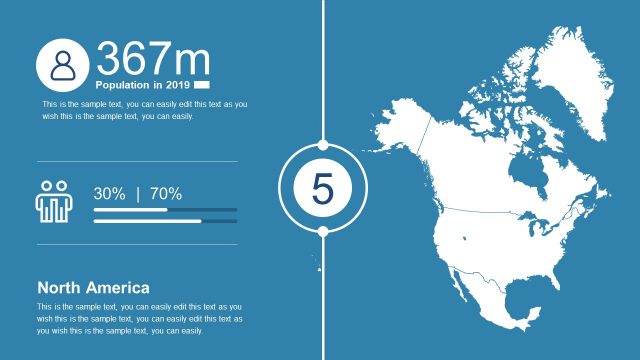
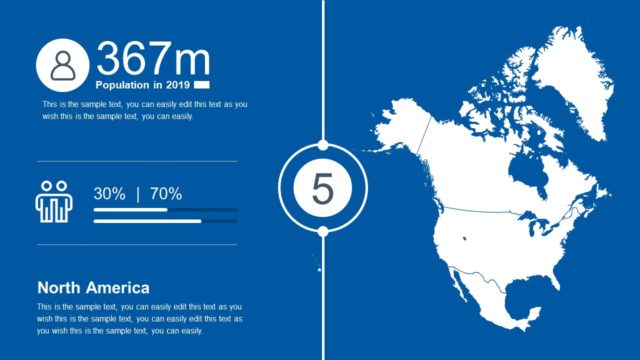
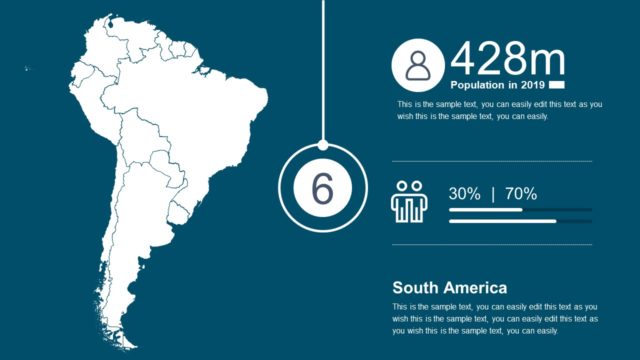
The slide features a map of Oceania positioned on the left side, with a light yellow background. To the right, there is a circular node containing the number '2' at the center, indicating a sequence. Above the node, a statistic shows '42m' with the label 'Population in 2019' aligned to the right. Below the node, two figures represent demographic proportions, with a horizontal bar indicating percentages. The text placeholders are arranged vertically, with one placeholder for the region name 'Oceania' and another for descriptive text. The overall layout emphasizes the map and key statistics.
How to Use It
This layout serves as a geographic data presentation, effectively summarizing population statistics for a specific region. It fits well in a sequence of slides that detail demographic information across various continents. This format is useful for business analysts or presenters needing to convey population data visually. It can be applied in reports, presentations on market research, or demographic studies, providing a clear overview of regional statistics.
Text Placeholders & Capacity
Keep your copy within these limits so it fits without resizing. Body slots can hold roughly 15-20 words each.
| Placeholder | Count | Max characters (approx.) |
|---|---|---|
| Slide title | 1 | 30 |
| Item heading | 1 | 5 |
| Item body | 1 | 50 |
| Body paragraph | 2 | 100 |
| Data label | 1 | 10 |
Slide Keywords
Download unlimited PowerPoint templates, charts and graphics for your presentations with our annual plan.
DOWNLOADReturn to #2 Editable Data Driven Maps Bundle.