Slide 22 of 32 from #2 Editable Data Driven Maps Bundle
Africa Continent Analysis Map PPT
Editable Africa Map with Data Points
- Map
- Continent Map
- Context Slide
- 16:9
- 100% Editable
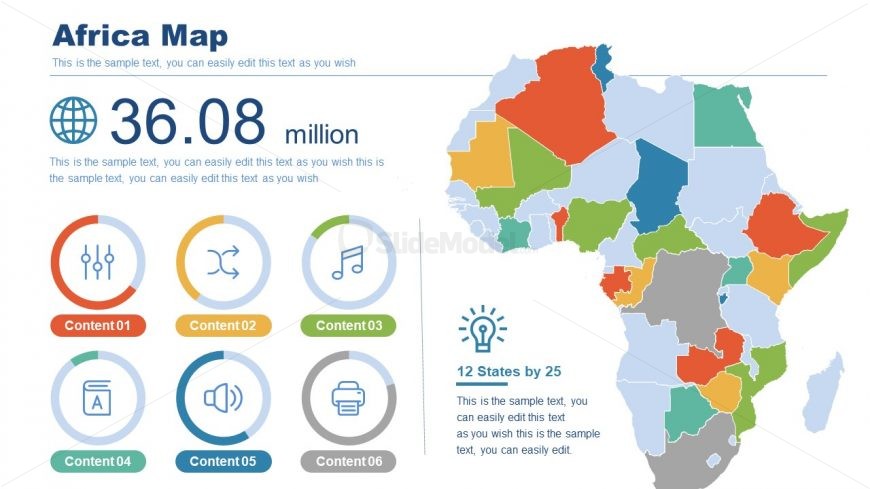
The Africa Map with Data slide from the #2 Editable Data Driven Maps Bundle offers a clear geographic data presentation with color-coded regions and key statistics. Ideal for demographic analysis and market overview, this slide template includes editable shapes and vector icons to enhance business presentations or educational content.
What’s on This Slide
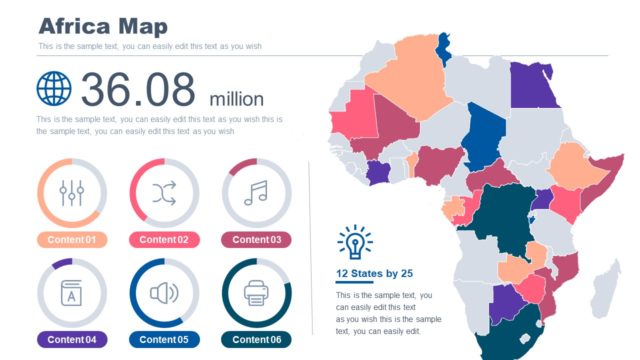
The slide features a map of Africa, prominently displayed on the right side. The map is color-coded to represent different regions or data points. To the left, there is a globe icon above a numerical value of 36.08 million, indicating a statistic related to Africa. Below this, there are six circular icons arranged in two columns, each labeled 'Content 01' to 'Content 06.' Each icon has a unique symbol representing different categories. There are text placeholders for titles and descriptions, with a clear visual hierarchy emphasizing the map and key statistics.
How to Use It
This layout serves as a geographic data presentation, showcasing demographic or statistical information about Africa. It fits well in a presentation sequence following an overview or introduction to a topic related to Africa. This structure is useful for analysts presenting regional data, marketers discussing market potential, or educators teaching geography. The combination of visual elements and data points allows for effective storytelling in geographic contexts.
Text Placeholders & Capacity
Keep your copy within these limits so it fits without resizing. Body slots can accommodate around 8-10 words each.
| Placeholder | Count | Max characters (approx.) |
|---|---|---|
| Slide title | 1 | 30 |
| Body paragraph | 3 | 80 |
| Item heading | 6 | 15 |
| Item body | 6 | 50 |
Slide Keywords
Download unlimited PowerPoint templates, charts and graphics for your presentations with our annual plan.
DOWNLOADReturn to #2 Editable Data Driven Maps Bundle.