Connecting lines in PowerPoint, also known as connector lines, is a simple but essential skill when you’re creating diagrams, flowcharts, org charts, or any slide where shapes need to show relationships. Appropriately done, connector lines move with the shapes they’re attached to, keeping your layout clean and aligned even when you rearrange slide content. In what follows, we will provide an overview of how to connect lines in PowerPoint, including the types of connector lines available, customization options, and formatting tips.
What Are Connector Lines in PowerPoint?
Connector lines are lines that link two shapes together, anchoring at specific connection points. Unlike regular lines, connectors stay attached when you move the shapes. This makes them especially useful in diagrams or charts where layout flexibility is needed.
Connector lines are available as:
- Straight connectors: These draw a direct, unbroken line from one shape to another. They’re ideal for clean, linear layouts, such as timelines, step-by-step workflows, or when vertical or horizontal alignment between elements is required.
- Elbow (angled) connectors: These connectors create a right-angle path between shapes, making one or more sharp turns. They’re commonly used in flowcharts and organizational diagrams where space is tight or elements are staggered.
- Curved connectors: These provide a smooth, arched line that links two shapes with a more fluid look. They’re useful for softer, more visual layouts, such as infographics, or when connecting elements that don’t align neatly otherwise.
Why Use Connector Lines Instead of Regular Lines in PowerPoint?
You can draw lines manually, but they won’t stay in place when you move shapes around. Connector lines solve this problem by:
- Locking to anchor points on shapes: Instead of floating loosely, connector lines snap to designated points along the border of shapes. These anchor points are built-in and appear when you hover near a shape’s edge while inserting a connector. Once snapped, they keep the line fixed to that specific spot, which means your visual connections stay intact, regardless of where the shapes move.
- Automatically adjusting length and direction: If you reposition a connected shape, the line doesn’t stay frozen; it stretches, shortens, or changes direction to maintain the connection. Whether you move a shape slightly or drag it across the slide, the line updates in real time to preserve clarity and alignment.
- Maintaining diagram alignment when repositioning objects: When multiple shapes are connected, shifting one doesn’t throw off the entire layout. Connector lines flex and reposition automatically, so your flowchart, org chart, or diagram maintains its structure and logic even as you rearrange content. This is particularly useful in collaborative settings where slide elements often get moved or adjusted.
Using connector lines saves time and avoids the frustration of having to redraw lines every time your layout changes. This makes it easy to create scalable diagrams that are easy to edit and expand according to the presenter’s needs.
Uses for Connecting Lines in PowerPoint
Now that you know the basic idea behind the use of connector lines instead of regular lines, here are some uses for connector lines:
1. Use in Flowcharts
When mapping out a workflow, software process, or decision tree, connector lines help illustrate progression, logic, and dependencies. When steps change or move, the connectors stay attached, keeping the chart readable and easy to update.
2. Organizational Charts
In HR or management presentations, connector lines make it easy to show reporting structures and departmental hierarchies. Using elbow connectors helps maintain space between roles and visually groups teams.
3. Making Timelines
For project planning or historical overviews, curved connectors can visually link milestones, events, or key dates. They add movement and help guide the viewer’s eye through a chronological narrative.
4. Creating Infographics
In marketing or education, connectors are used to tie related concepts, show comparisons, or build visual storytelling around icons or statistics. They keep layouts clean while highlighting relationships.
5. Designing Interactive Presentations
In digital environments, such as kiosks, training modules, or slide decks with triggers, connector lines are often paired with hyperlinks or action buttons to create guided navigation. They support both form and function by connecting clickable elements in a meaningful way.
6. Technical Diagrams
Engineers and IT professionals use connector lines in PowerPoint to represent network diagrams, system architecture, or process automation flows. The lines make the structure easy to follow and update as systems evolve.
How to Connect Lines to Shapes in PowerPoint
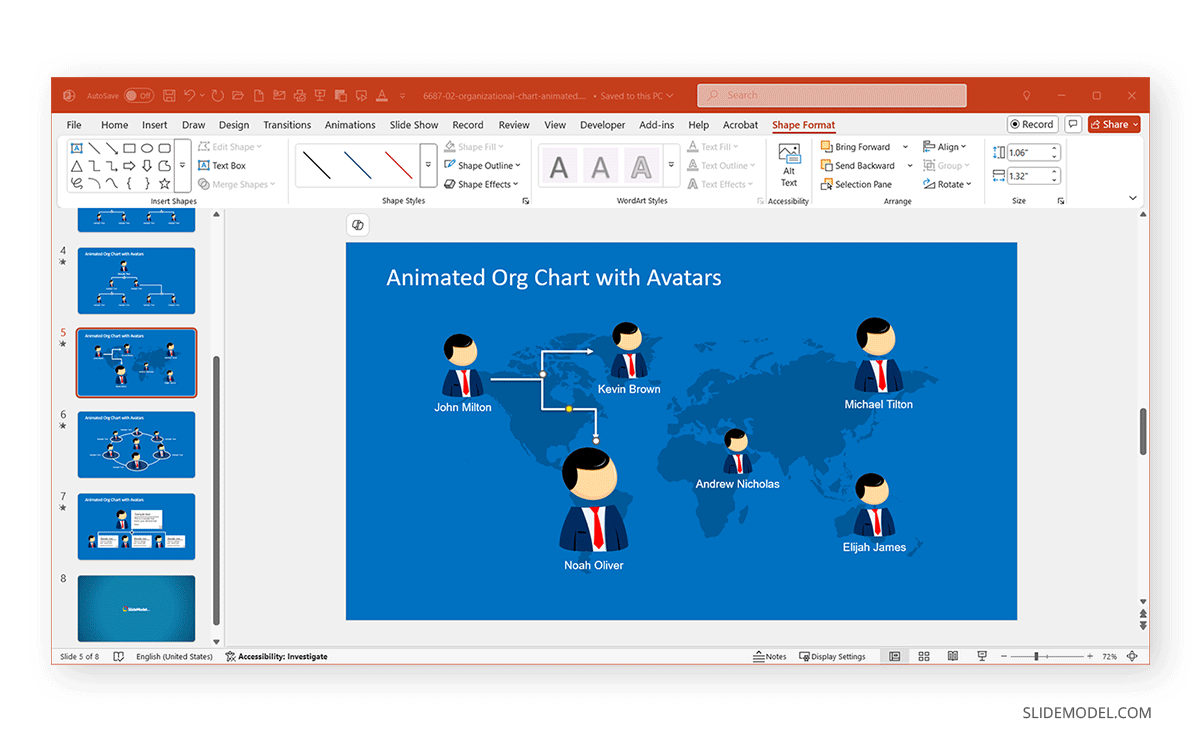
To understand the use of connector lines, let’s first start with the basics, such as connecting a line between two shapes. For the purpose of this post, we will use the Animated Org Chart PowerPoint Template to show the use of connector lines.
How to Connect Lines in PowerPoint
Step 1: Go to the Insert tab on the Ribbon menu and select Shapes, from the Lines section, choose a connector (e.g., straight, elbow, or curved).
Step 2: Move your cursor over the first shape, and you will see connection points (small dots). Click on a connection point to begin the line and drag to the second shape, and hover until you see its connection points.
Step 3: Click once more to attach the other end of the connector. The connector is now attached.
How to Connect 2 Lines in PowerPoint
PowerPoint doesn’t let you merge two independent lines the way vector design tools do, but you can simulate a connection by:
1. Branching From a Shared Shape: The most effective way to simulate connected lines is by anchoring both lines to a central shape. For example, if two arrows should meet at a decision point, place a shape (like a circle or diamond) between them and attach each connector to the shape’s anchor points. This keeps the relationship of the shapes intact.
2. Manual Alignment with Snap to Grid or Snap to Shape: For a more freeform diagram, you can align two lines so they appear connected. Turn on Gridlines or Guides via the View tab. This helps align line endpoints precisely, giving the appearance of a single, continuous line.
3. Group Elements Together: Once your lines and any related shapes are aligned, group them using Ctrl/Command+G. This ensures that any movement maintains the layout’s integrity and preserves connectivity.
4. Create Continuous Lines using Curve or Freeform: If you want to draw a single, uninterrupted line that curves or bends, use the Curve or Freeform tool from the Shapes menu. These tools enable you to draw a custom path with multiple points, providing complete control over the flow and style.
How to Draw Connecting Lines in PowerPoint Between Multiple Shapes
For flowcharts or organizational charts, follow these steps:
Step 1: Go to Insert -> Shapes -> Connector and select a connector type.
Step 2: Attach connectors one by one between shapes using the built-in anchor points.
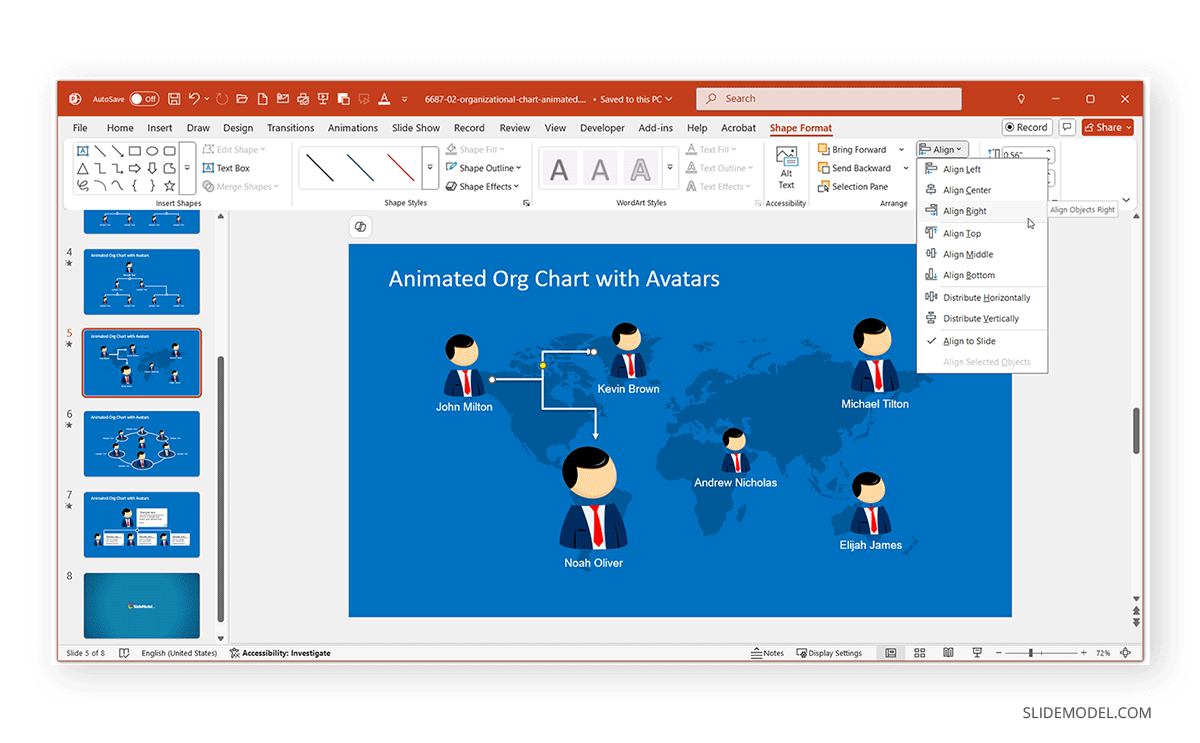
Step 3: Use the Align and Distribute tools under the Shape Format tab to keep spacing even.
How to Make Lines Connect in PowerPoint Automatically
PowerPoint doesn’t automatically detect shape proximity to create connectors. However, you can streamline the process by following these simple steps:
Step 1: Use SmartArt tools for simple flow or hierarchy diagrams. Connectors are built into these diagrams, and you can also use PowerPoint diagram templates that include connectors.
Step 2: Once the connector lines are set up, duplicate them and then drag the ends to new shapes.
Step 3: Hold down Shift while drawing to keep connector lines perfectly horizontal, vertical, or diagonal.
Customizing Connector Lines in PowerPoint
Once your connector is in place, you can format it:
1. Change Line Color: You can change the line color via Shape Format -> Shape -> Outline.
2. Connector Size: Other than drag and drop, you can also use the Size menu in the Shape Format tab to change the size of the connectors by specifying height and width.
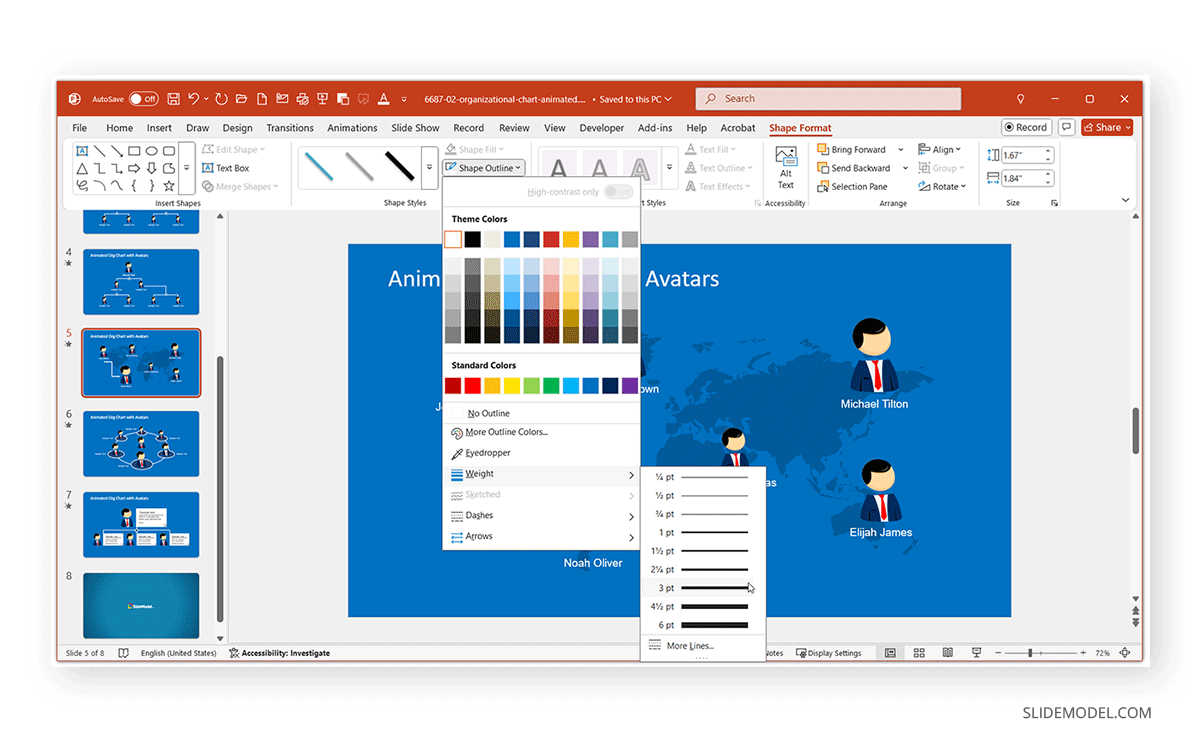
3. Adjust Thickness: To adjust the thickness of the selected line, go to Shape Format -> Weight and select a weight that reflects your needs to make the line thick or thin.
4. Change Connector Type: Right-click on the connector and choose a different style (e.g., straight, elbow, or curved) to change the connector type.
5. Add Arrowheads: Go to Shape Format -> Arrows to add arrow heads.
6. Arrange Connectors: By using the options in the Arrange menu in the Shape Format tab, you can move the connectors backward or forward to suit your design needs.
7. Align and Rotate Connectors: The Arrange menu in the Shape Format tab also provides options to align and rotate the selected connector(s).
8. Add Shape Styles: From the Shape Format tab, go to the Shape Styles menu to select a specific style for your connector. These shape styles come with different line types, with various colors and shape thickness formats. You can also further customize the color of a selected style via Shape Outline.
9. Add Shape Effects: You can select a connector to add various effects to it via the Shape Effects menu via Shape Format. This includes standard presets, as well as effects for adding shadow, reflection, glow, soft edges, 3-D rotation, and bevel.
10. Animate Connectors: To animate connectors, select a connector, go to the Animations tab, and select an animation to apply to it.
How to Fix Connector Lines That Don’t Attach Properly
If your connector isn’t sticking to the shape, check the following:
1. Make sure you’re connecting to a connection point, not just the shape border.
2. Try zooming in for more precision to move and connect the lines.
3. If shapes were grouped or imported, ungroup them before attaching connectors.
4. For lines that look misaligned:
- Use Align -> Align Center/Middle under the Shape Format tab.
- Enable View -> Guides or Gridlines to assist with placement.
5. See if there are overlapping elements within the slide hindering connectivity.
Bonus Tip: Use Lock Drawing Mode for Multiple Connectors
If you’re adding several connectors in a row, such as for a complex diagram or flowchart, PowerPoint’s Lock Drawing Mode can save you a lot of time. This mode allows you to keep the connector tool active so you can draw multiple lines without reselecting the shape each time.
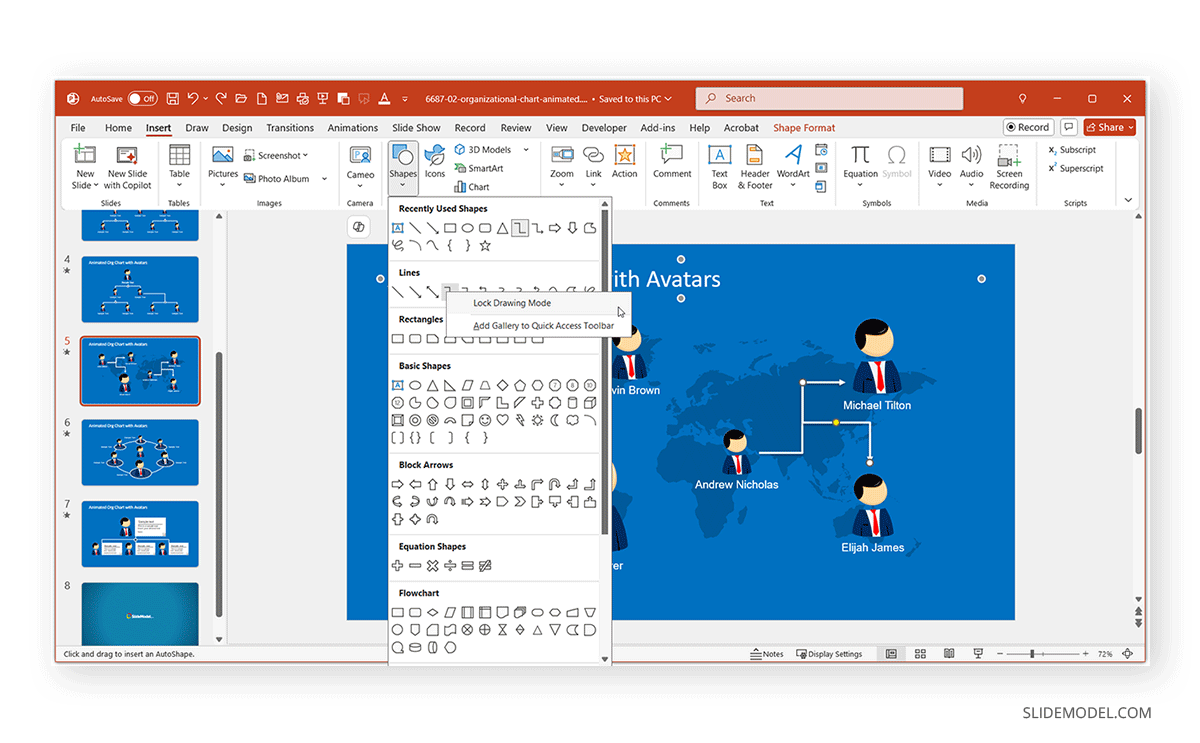
Step 1: To use this feature, go to Insert -> Shapes, right-click on your desired connector type, and select Lock Drawing Mode.
Step 2: Now, draw connectors between shapes continuously.
Step 3: Press Esc when you’re done to exit Lock Drawing Mode.
This feature is particularly helpful when you need to connect many shapes across a slide quickly.
Final Words
Learning to use connector lines in PowerPoint lets you go beyond simple slides and into the realm of structured, compelling visuals. This can have many real-life applications, ranging from designing a process flow to creating a custom layout and making mind maps.
Once you’re familiar with how they behave and how to adjust them, connector lines become one of the most handy tools at your disposal. They not only make your diagrams cleaner but also save you a ton of time when layouts shift or content needs change over time. Since connector lines don’t have to be independently moved like individual lines, you can keep the diagrammatic flow aligned and save time on editing slides with too many slide elements, such as individual lines that need to be realigned if a part of the diagram changes.