Infographics Gender Icon PowerPoint Slide
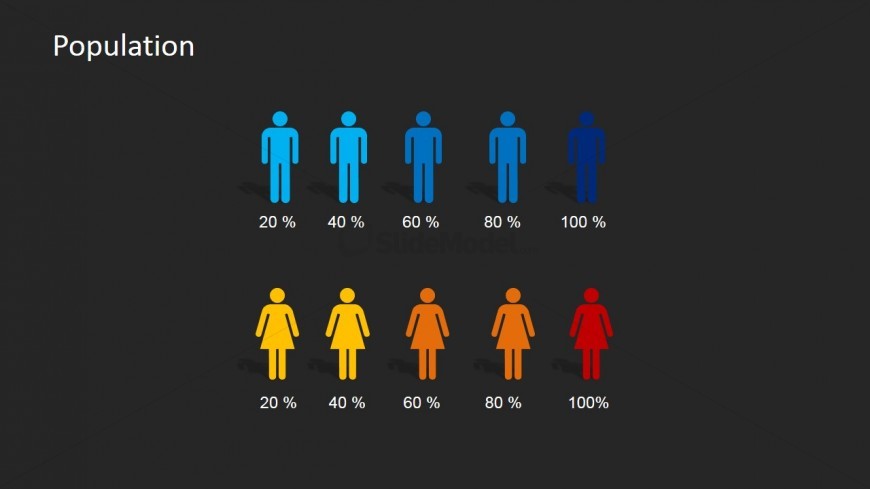
The gender icon infographic for PowerPoint found on the slide design may be used to show the composition of each focus group targeted by the marketing team. It may also be used to illustrate the level of customer and brand loyalty, or level of market penetration, in each target market.
The PowerPoint slide contains ten minimalist icons of characters, five for male and five for female, each of which have text placeholders below them where the corresponding percentages for that specific focus group may be inserted. The male icons are colored in different shades of blue, shown from lightest to darkest, while the female icons are shown in a gradient from yellow to orange to red. The slide design contains a black presentation background. All PowerPoint objects are 100% editable to suit the presenter’s needs and preferences.
Return to Demographics Infographic Elements Clipart for PowerPoint.
Download unlimited PowerPoint templates, charts and graphics for your presentations with our annual plan.
DOWNLOADReturn to Demographics Infographic Elements Clipart for PowerPoint.


