Visual Circular Diagram PowerPoint Template – Interference is a physical phenomenon involving two waves that superpose to form another wave. It is seen most dominantly in the rippling effect in water. Executing wave propagation, the ripples multiply almost exponentially from two or more original ripples
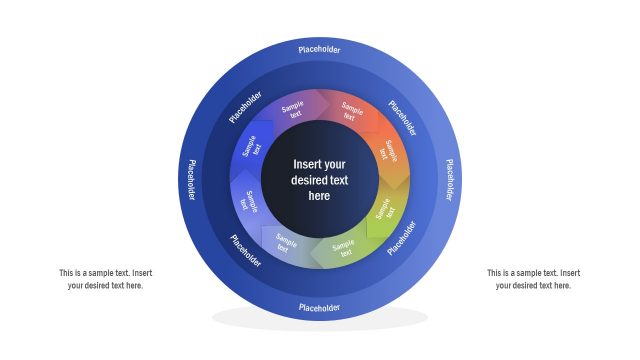
The user can use this principle as a metaphor using the Visual Circular Diagram PowerPoint Template. He/she can make use of the phenomenon to illustrate the sub-elements of each component of any business process. The rippling effect can be demonstrated by highlighting the different steps under a major procedure. This effect is made clearer by the rippling outline of the circular shapes which represent the main steps.
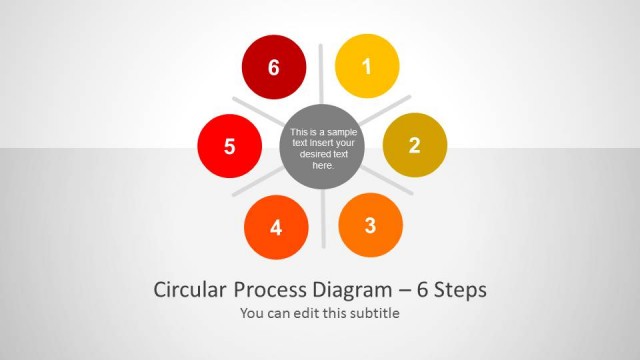
Using the template, the user can provide a short description of each major process. In this way, the procedures can be brought to light to provide an outline. This can serve as an introduction before the user elaborates the components under each process. This is illustrated by the small circles which extend from the large center circle. In theory, this recreates wave propagation by showing the components that are derived from a single process.
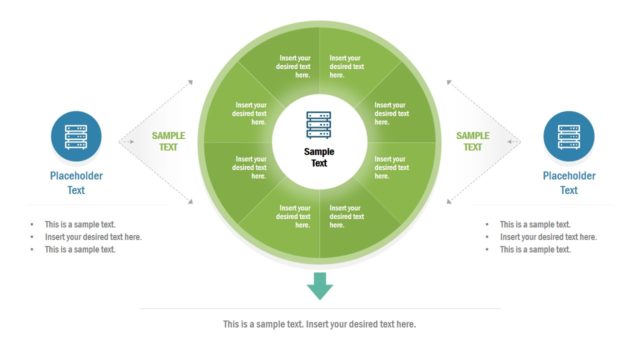
Four of the five slides in the PowerPoint template highlight the components of a single process in the cycle. This is shown one process at a time to focus on a singular business concept and avoid overloading the slide with information. Thus, the user has more room to transmit the message properly and discuss the contents of the presentation in a neat and organized manner.
The circular PowerPoint shapes have been specifically designed to be light on the eyes. This helps make the content stand out without looking too crowded on the slide. A lightbulb icon at the center can represent the brainstorming or thinking process involved.
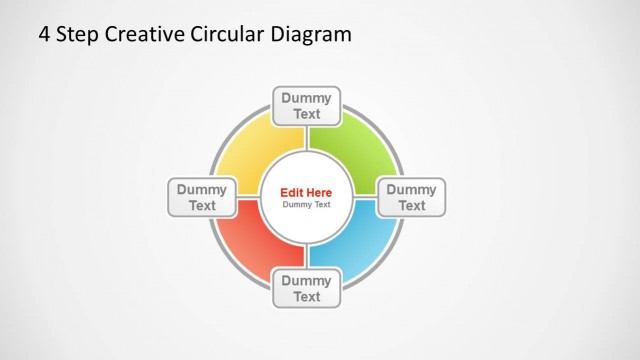
The Visual Circular Diagram PowerPoint Template can be used in presentations involving circular processes and plans. It is most ideal for circular business procedures and marketing cycles. However, the user may also edit the slides and their content to fit any type of business presentation. The user may also download other PowerPoint templates from the Gallery, such as 5 Step Creative Circular Diagram Design for PowerPoint.
What’s inside this template
Example presentation scenarios
- A consultant can use the four-node cycle diagram to explain how major business activities connect around one core idea during a client process review.
- A marketing manager can present campaign planning as a ripple effect, using the colored outer nodes for stages and the arc-dot subprocess callouts for actions under one stage.
- An operations leader can map a procedure by placing the main workflow in the central circular diagram and using the focused arc slides to discuss subprocess dependencies.
- A product manager can explain how one idea expands into related tasks by using the lightbulb hub, concentric rings, and surrounding node labels.
Features
- 100% editable presentation template
- Compatible with Microsoft PowerPoint and Google Slides
- 16:9 aspect ratio slides
- Scalable vector shapes, icons and illustrations
- AI-Ready for Microsoft Copilot and Claude
- Instant access and download
Frequently asked questions
Q: How should I present the cycle without making it feel like four unrelated topics?
A: Start with the central lightbulb as the shared concept, then name each of the four outer circles as a major component of the cycle. Use the focused arc slides to unpack one component at a time. This keeps the audience anchored to the whole system while giving each subprocess enough space.
Q: Who is this circular diagram best suited for?
A: This template fits presenters who need to explain cause-and-effect relationships, recurring workflows, or planning cycles without relying on tables. Consultants, marketers, project managers, and operations teams can use the central hub and ripple structure to show how one business idea spreads into coordinated actions or dependent subprocesses.
Q: Why use ripple rings and arc dots instead of a standard cycle diagram?
A: The ripple metaphor shows that a central idea can create visible effects around it. The large colored nodes communicate the main process areas, while the smaller arc dots break one area into supporting details. This design helps audiences understand both the overall loop and the local steps inside each segment.


Visual Circular Diagram PowerPoint Template
5-slide circular diagram presentation template for process cycles, subprocess callouts, and ripple effects
This is a 5-slide circular diagram presentation template for mapping processes, subprocesses, and idea effects. It includes a central lightbulb hub, four-node cycle diagram, concentric ripple rings, and highlighted arc-dot subprocess callouts. Designed for business presenters explaining connected steps in Microsoft PowerPoint and Google Slides.
- Category
- Diagrams
- Rating


 Loading...
- Aspect ratio
- 16:9, 4:3
- Item ID
- 6994-01
- Colors
 Microsoft PowerPoint
 Microsoft Copilot
 Claude for PowerPoint
Other formats supported
Subscribe today and get immediate
access to download our PowerPoint templates.