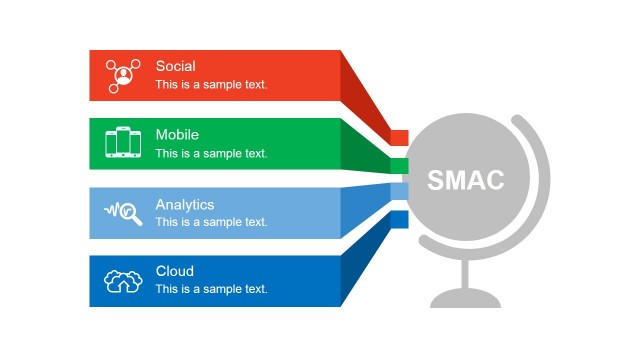
SMAC Circular Diagram for PowerPoint– SMAC is a concept that stands for Social, Mobile, Analytics and Cloud technologies. It characterizes the period of fifth wave Information Technology architecture. It is best described as the promise of a continuous digital development. Designed with creative circular figures, this PowerPoint template can create presentations that are easy to grasp.
SMAC is the new trend that is driving business innovation, and the world in that matter. The term Social refers to the connectivity of people. In business, it can symbolize public relations. Mobile represents access of technology anywhere, anytime. An e-commerce site for example features direct sharing links for Facebook, Twitter or Instagram. Analytics mean wise programming. Cloud is the data storage option of Microsoft and other relative applications. This gives the user an online data storage which does not eat up space from a hard drive.
This Office template is ideal for business and marketing presentations. A new and friendlier design always attracts more customers. Science and technology is another perfect subject for these slide designs. The user can create a descriptive report about the literal concept using the template.
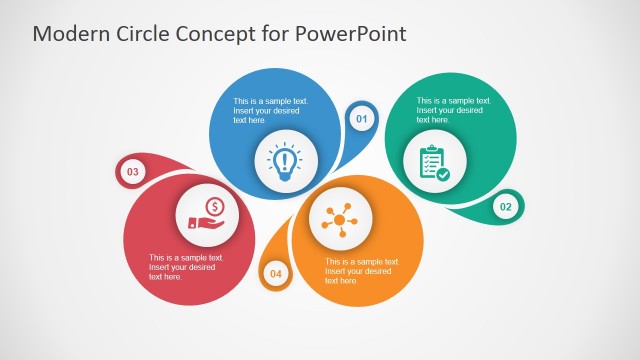
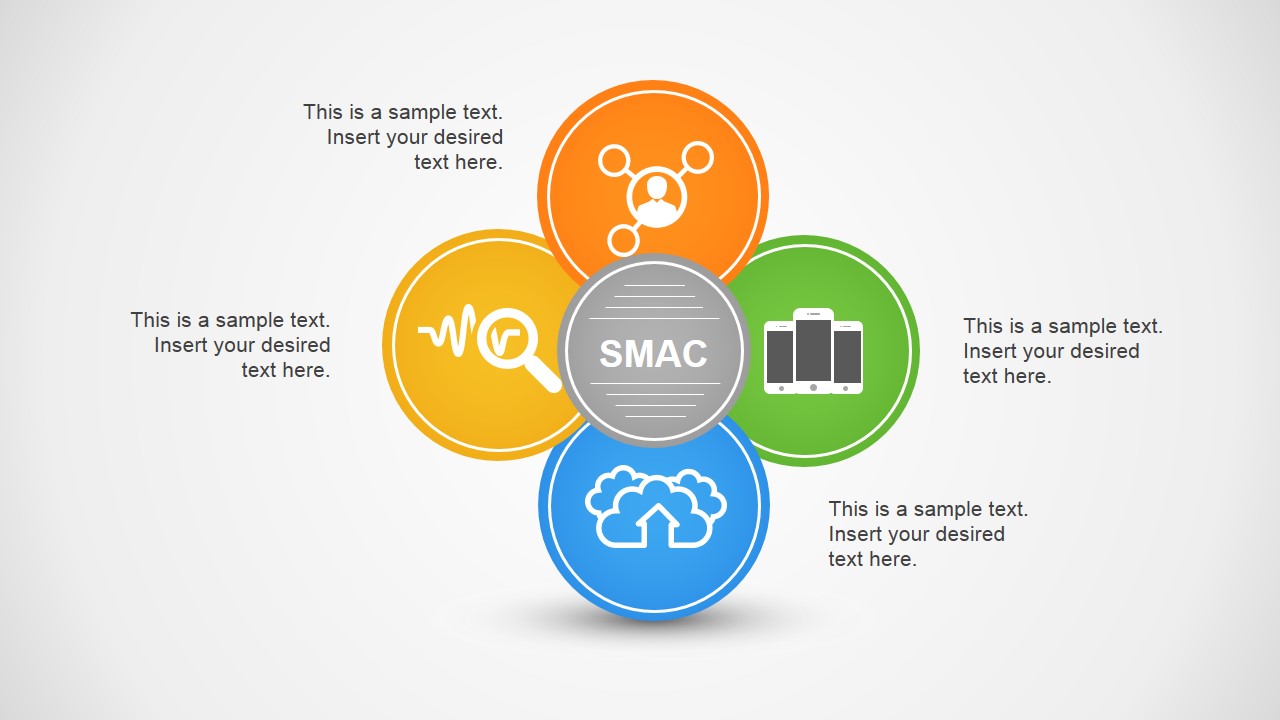
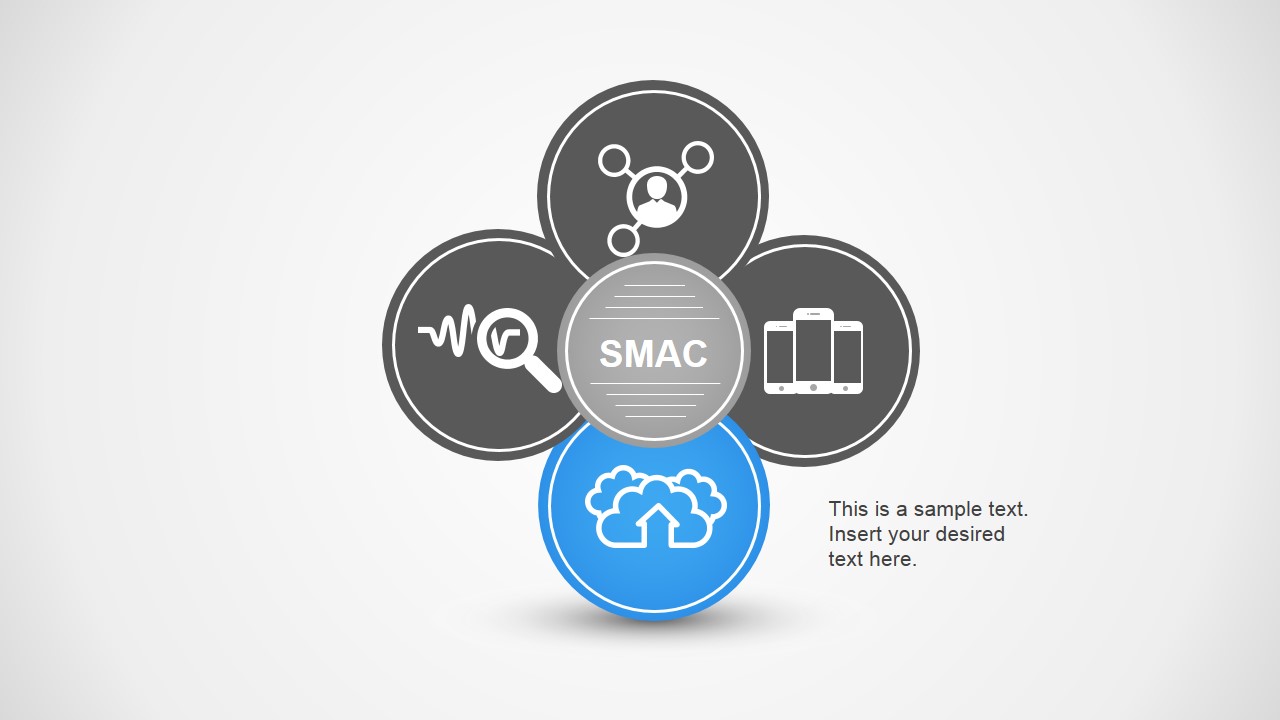
The first slide design is a colorful 5-piece set of circle PowerPoint shapes. The circle in the middle display the keynote title SMAC. The surrounding circles are colored orange, green, blue and yellow. In the consecutive slide, the user can further elaborate on each aspect of SMAC. The orange circle with a network icon can be found in the second slide. The third slide illustrates a green circle with mobile icons. The presenter can explain on the Cloud field of SMAC using the 4th slide. The 5th slide with a magnifying glass icon can talk about Analysis.
Make way for functional and smart presentations with SMAC Circular Diagram for PowerPoint. Social Mobile Analytics Cloud PowerPoint Template is downloadable at the SlideModel gallery.
What’s inside this template
Example presentation scenarios
- An IT strategy lead can use the four-part circular overview to introduce SMAC as a shared digital transformation model for executives.
- A marketing manager can use the social and mobile highlight slides to explain how customer engagement channels connect to technology decisions.
- A cloud consultant can use the cloud highlight slide to frame storage, access, or platform migration as one part of a larger SMAC approach.
- A business analyst can use the analytics highlight slide to explain how data interpretation supports decisions across the other SMAC pillars.
Features
- 100% editable presentation template
- Compatible with Microsoft PowerPoint and Google Slides
- 16:9 aspect ratio slides
- Scalable vector shapes, icons and illustrations
- AI-Ready for Microsoft Copilot and Claude
- Instant access and download
Frequently asked questions
Q: How should a presenter explain the SMAC model with this template?
A: Start with the full circular diagram to define the acronym and show that the four concepts are connected. Then move through the highlighted segment slides in the order that matches the audience need. Keep each text block focused on one business implication, such as customer reach, mobile access, cloud storage, or analytics-driven decisions.
Q: Who is this diagram best suited for?
A: This template is best for presenters who need to teach or frame a technology concept rather than show detailed performance data. IT managers, marketing strategists, consultants, and trainers can use the single-segment slides to explain how one SMAC pillar supports a broader digital business discussion.
Q: Why does the circular structure work for SMAC communication?
A: The circle arrangement makes SMAC feel like an interdependent model instead of a linear checklist. The center label anchors the framework, while the outer icons make each pillar recognizable. The gray-and-color treatment on the detail slides draws attention to one concept without losing the context of the other three.







SMAC Circular Diagram for PowerPoint
5-slide SMAC circular diagram presentation template with technology icons and highlighted concept segments
SMAC Circular Diagram for PowerPoint is a 5-slide presentation template for explaining Social, Mobile, Analytics, and Cloud as a connected technology model. It includes a four-part circular diagram, icon-labeled concept bubbles, and single-segment highlight slides for business, marketing, and technology presenters in Microsoft PowerPoint and Google Slides.
- Category
- Diagrams
- Rating


 Loading...
- Aspect ratio
- 16:9
- Item ID
- 6820-02
- Colors
 Microsoft PowerPoint
  Microsoft Copilot
  Claude for PowerPoint
 Other formats supported
Subscribe today and get immediate
access to download our PowerPoint templates.