Real Estate Cycle Diagram Template for PowerPoint
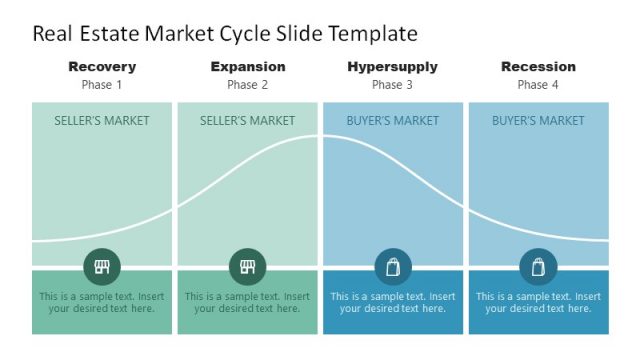
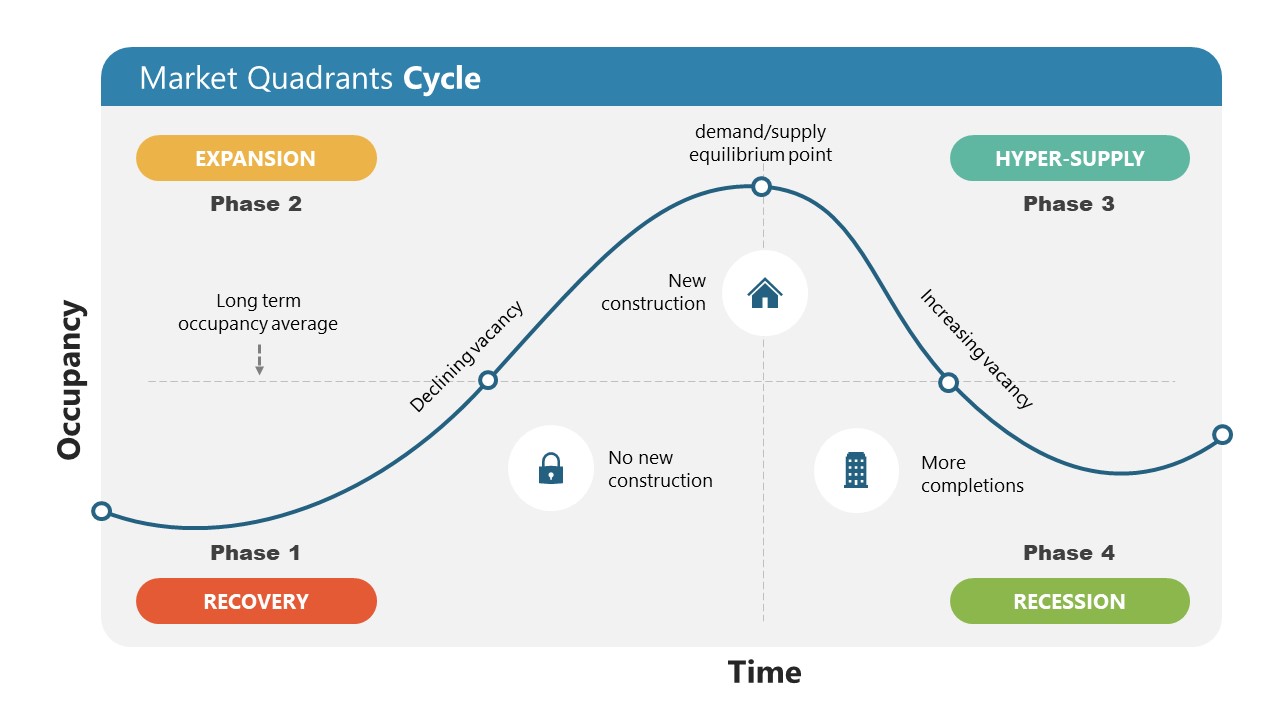
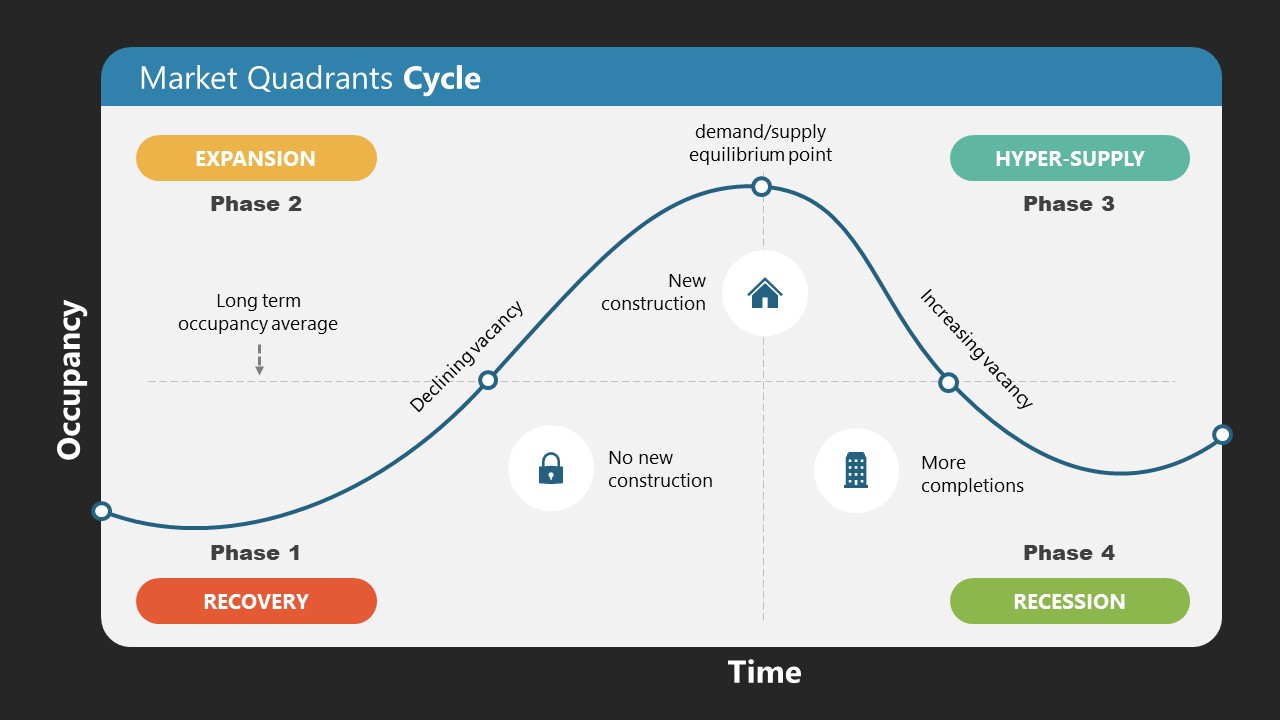
The Real Estate Cycle Diagram Template for PowerPoint is a graphical representation of four Real Estate cycle phases. In every business cycle, four typical segments (of rise & fall in demand-supply) have corresponding time frames depending on economic and geographical circumstances. Similarly, in Real Estate, such four phases are collectively called the real estate market quadrants cycle that are:
- Recovery: The time when investors understand that the crisis is over, and they start buying and constructing
- Expansion: At this point, the property starts selling, and the market prices start increasing due to decreasing vacancy
- Hyper-supply: This post-equilibrium phase is characterized by declining vacancy due to increased selling rates. Here the investment opportunities are fewer. This episode is the mirror opposite of the expansion.
- Recession: It is an exact counter phase of the recovery. In this phase, the prices tumble down, and no new development is done to multiple economic situations.
This Real Estate Cycle Diagram Template for PowerPoint shows this complete cycle diagram in four graphical quadrants. It carries two PowerPoint background variations of the slide template. The graph carries a bell shape with the occupancy factor on the y-axis and the time on the x-axis. In the background, the crossing lines develop four quadrants, each representing the episodes of the cycle, i.e., the initial growing slope indicates recovery & expansion. At the same time, the decline depicts the hyper-supply & recession. Each segment has supporting statements and symbols to make the slide design more communicative. For instance, the lock infographic symbol in the recovery phase represents no new constructions, and the building symbol in the recession phase is for more completions. Similarly, color text boxes are used to mention the title for each segment.
Professionals can use this 100% editable Real Estate Cycle Diagram Template for PowerPoint for their business meetings and training. It can be helpful to discuss the current property market situations to guide investors in consultation discussions. So, download and try this PPT template today!
You must be logged in to download this file.
DOWNLOAD- Category
- Timelines & Planning
- Rating

 Loading...
- Size
- 16x9
- Item ID
- 21670-01
- Colors
Subscribe today and get immediate
access to download our PowerPoint templates.