Slide 1 of 2 from Plan Do Check Act Infographic PowerPoint Template
Editable Plan Do Check Act Infographic PPT Design Template
PDCA Cycle Infographic for Presentations
- Diagram
- Circular Cycle
- Process Slide
- 16:9
- 100% Editable
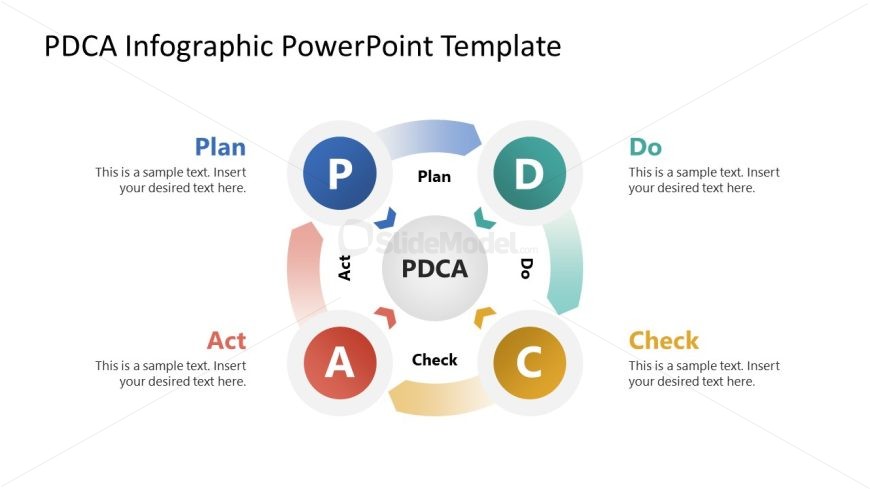
The PDCA Cycle Diagram slide from the Plan Do Check Act Infographic PowerPoint Template visually represents the continuous improvement process with a circular flow. This editable slide template is ideal for business presentations and project planning frameworks, featuring vector icons and editable shapes that highlight each phase of the Plan, Do, Check, and Act cycle for clear communication in corporate presentations or training sessions.
What’s on This Slide
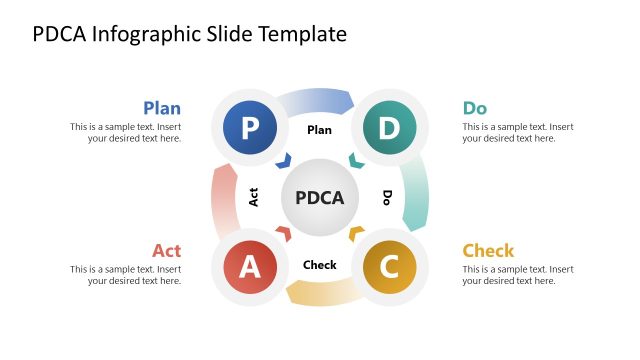
The slide features a circular diagram divided into four segments labeled Plan, Do, Check, and Act. Each segment contains a circular node with a letter representing each phase. The nodes are positioned at the top, bottom, left, and right, surrounding a central node labeled PDCA. Text placeholders are present within each segment, aligned centrally, allowing for additional details. The overall layout is symmetrical, with a clean white background and colorful segments that enhance visual separation. Arrows connect the segments, indicating a cyclical process.
How to Use It
This layout serves as a process diagram illustrating the PDCA cycle. It is effective for presentations focused on quality management, project planning, or continuous improvement. The circular flow emphasizes the iterative nature of the process. This slide fits well at the beginning of a presentation to introduce the PDCA framework or as a summary slide to encapsulate the process. It can be utilized in business meetings, training sessions, or strategic planning discussions.
Text Placeholders & Capacity
Keep your copy within these limits so it fits without resizing. Node body slots can hold about 10 words each.
| Placeholder | Count | Max characters (approx.) |
|---|---|---|
| Item heading | 4 | 20 |
| Item body | 4 | 50 |
| Slide title | 1 | 50 |
Slide Keywords
Download unlimited PowerPoint templates, charts and graphics for your presentations with our annual plan.
DOWNLOADReturn to Plan Do Check Act Infographic PowerPoint Template.