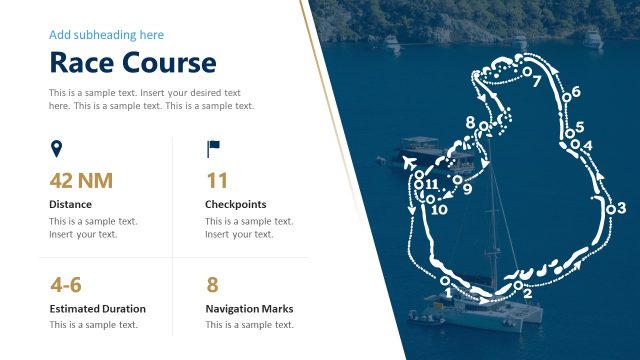
Slide 8 of 13 from Mountain Ultra Trail Event PowerPoint Template
Race Statistics KPI Dashboard Mountain Ultra Trail PowerPoint
Race Statistics Overview for Mountain Ultra Trail
- Text Layout
- List Blocks
- Statistics Slide
- 16:9
- 100% Editable
The Race Statistics Overview slide from the Mountain Ultra Trail Event PowerPoint Template offers a clear layout for presenting key event data. Designed for business presentations and pitch decks, this slide uses editable shapes and vector icons to highlight participation, elevation gain, and volunteer metrics, making it ideal for summarizing event statistics in a corporate presentation or stakeholder update.
What’s on This Slide
The slide features a green background with a prominent title at the top left, stating 'Race Statistics.' Below the title, there is a placeholder for a subheading. The layout includes two columns, each containing two sections. The left column displays statistics such as '35 Countries' and '450 Volunteers,' while the right column shows '5,400 m Elevation Gain' and '1,200 Participants.' Each statistic has a corresponding placeholder for additional text beneath it. The overall design includes a large image of runners in a mountainous landscape on the right side, enhancing the visual appeal.
How to Use It
This layout serves to present key statistics related to an event, making it suitable for summarizing important data points. It fits well in a presentation sequence after introducing the event details and before discussing logistics or participant engagement. This structure is useful for event managers or marketers to highlight critical metrics, such as participation levels and geographical reach, effectively communicating the scale and impact of the event to stakeholders and audiences.
Text Placeholders & Capacity
Keep your copy within these limits so it fits without resizing. Node labels can hold about 3-5 words each, while node bodies can accommodate roughly 10 words.
| Placeholder | Count | Max characters (approx.) |
|---|---|---|
| Slide title | 1 | 30 |
| Subtitle | 1 | 50 |
| Item heading | 4 | 20 |
| Item body | 4 | 50 |
Slide Keywords
Download unlimited PowerPoint templates, charts and graphics for your presentations with our annual plan.
DOWNLOAD