Transform common marketing reports into eye-catching presentations with the Innovation Funnel Diagram Template for PowerPoint. The template features elements related to market penetration and commercialization.
Innovation, in business terms, refers to the modification of current technologies in order to create an upgraded product for the current market. Most companies do this by releasing several succeeding versions of a product line. This keeps their customers interested and waiting for new developments to the current model. In some cases, innovation can even lead to creating a new market. This is possible because some innovations are expressly unique to a certain brand or company, resulting in a niche market.
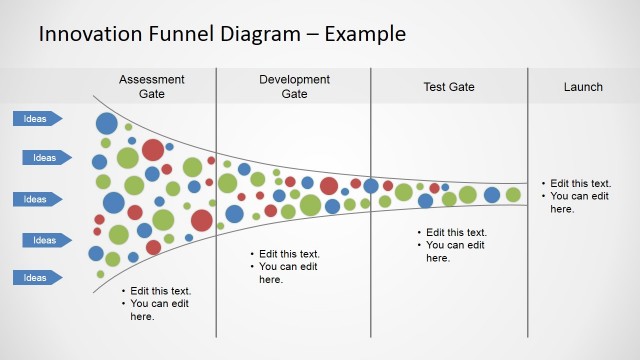
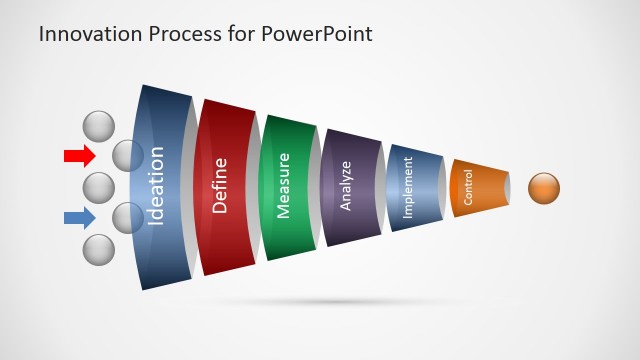
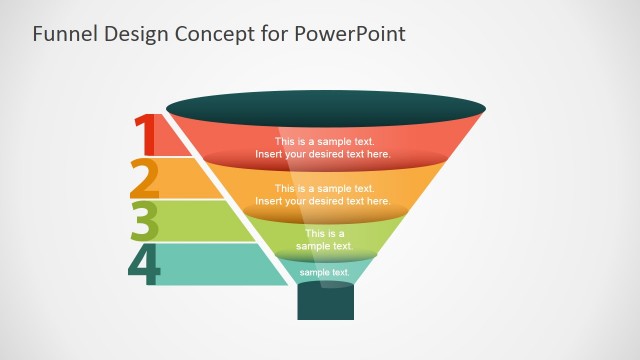
The slide designs presents a set of innovation funnels diagrams. These are graphical representations of the process of filtering ideas and information from the initial stages of product development to the final product. Using the diagram, the presenter can demonstrate how research typically covers a wide array of possible ideas that are narrowed down as the stage enters development. The developed ideas are then processed to become marketable, resulting in commercialization.
The funnel diagram is presenter horizontally. The funnel is a representation of the filtering and selection procedure which the concerned elements undergo to ensure that only the best pass the standards. It is divided into three segments, labeled research, development and commercialization. A twisting clipart, including circular PowerPoint shapes can be found in the funnel to represent the filtering process. Arrows and labels direct the flow of the presentation, pointing out specific details.
Suitable for manufacturing proposals for new or improved products, the Innovation Funnel Diagram Template for PowerPoint has a green color scheme that can be edited through PowerPoint Design menu. The presenter can edit the position or arrangement of the PowerPoint objects depending on the required layout. Any modification will not affect the image resolution of the design. The presenter can complement the deck with any of our PowerPoint Shapes and give a greater visual impact with metaphors related to the main topic of the presentation. Also, check our article about innovation strategy.
What’s inside this template
Example presentation scenarios
- A product manager can present a new product pipeline to leadership by using the stage-lane funnel to show which ideas are in research, development, and commercialization.
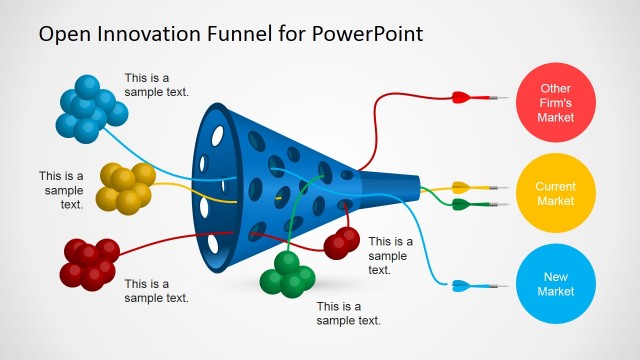
- An innovation director can explain an open innovation model to partners by using the open funnel with firm boundaries, new market outputs, and current market outputs.
- A marketing strategist can outline commercialization decisions by using the horizontal funnel to connect research inputs with a final current market outcome.
- An R&D lead can run a portfolio review by using the circular idea markers and arrow paths to show which concepts are filtered, redirected, or advanced.
Features
- 100% editable presentation template
- Compatible with Microsoft PowerPoint and Google Slides
- 16:9 aspect ratio slides
- Scalable vector shapes, icons and illustrations
- AI-Ready for Microsoft Copilot and Claude
- Instant access and download
Frequently asked questions
Q: How should a presenter explain the innovation funnel without making it feel like a generic process diagram?
A: Start with the wide research side as the idea universe, then explain each filter as a decision rule, such as feasibility, fit, or market potential. Use the stage-lane slides to separate research, development, and commercialization, and reserve the market outcome labels for the business result, not for operational details.
Q: Who benefits most from this innovation funnel format?
A: This template fits product managers, innovation teams, R&D leads, and marketing strategists who need to show how many inputs become fewer qualified opportunities. It is especially useful when the audience must understand selection logic, firm boundaries, and the difference between current market and new market outcomes.
Q: Why does the funnel metaphor work well for innovation planning?
A: The funnel shape makes scarcity and selection visible: many ideas enter on the left, but only a few survive toward commercialization. The circular markers show individual concepts, while arrows and spiral loops imply screening, redirection, and refinement. This visual metaphor reduces the need for long explanations of stage-gate filtering.


Innovation Funnel Diagram Template for PowerPoint
8-slide presentation template with horizontal innovation funnel diagrams for research, development, and commercialization
This is an 8-slide innovation funnel diagram template for Microsoft PowerPoint and Google Slides. It shows horizontal funnel layouts, research-development-commercialization stage lanes, open innovation paths, and filtering coil metaphors. Product, marketing, strategy, and innovation teams can explain how ideas narrow into current or new market outcomes.
- Category
- Diagrams
- Rating


 Loading...
- Aspect ratio
- 16:9, 4:3
- Item ID
- 6745-03
- Colors
 Microsoft PowerPoint
 Microsoft Copilot
 Claude for PowerPoint
Other formats supported
Subscribe today and get immediate
access to download our PowerPoint templates.