Discuss time and project management using the template Hourglass of Time Shapes for PowerPoint. Hourglasses have been used to measure time since the 14th century. One can measure the time by the amount of sand that has passed from the top part of the hourglass, to its bottom. When all of the sand is found at the bottom, it means that time has run out.
Demonstrate different periods with the hourglass PowerPoint graphics. Apply the hourglass concept to project reports and analysis. The graphics help portray a relative view of time, by comparing time spent against remaining time. The design is flexible and easy to adapt. Any alteration regarding color and size will not affect the graphic resolution.
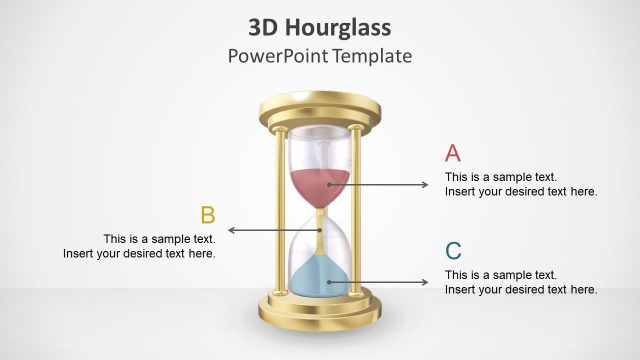
All slides of the PowerPoint template contain the hourglass graphic. The first slide features three hourglass shapes, with two flanking a middle one. This acts as a cover slide and is appropriate in time management presentations. The second slide compares the top and bottom halves of the hourglass. Arrows, placed next to each half, direct the flow of the sand in the hourglass. Text placeholders beside the arrows can have the relevant descriptions. Any alteration regarding color and size will not affect the graphic resolution.
A plain hourglass on the third slide has four arrows pointing to text placeholders. The arrows are located in key locations of the hourglass. These can signify the budgeted time, the start of the project, its implementation, and its end. The presenter can provide progress reports for each interval. The fourth and sixth slides in the Office template contain five hourglass shapes. Each of the hourglasses represents a certain time. For example, the first hourglass, which shows the top half at 100%, indicates that the project has not yet begun.
Create various time-based reports using the Hourglass of Time Shapes for PowerPoint. Make suggestions and revisions to improve time management using the PowerPoint template.
What’s inside this template
Example presentation scenarios
- A project manager can use the percentage hourglass diagram to show how much of a schedule has passed and what work remains before a deadline.
- A consultant can use the opposite hourglass layout to compare time spent on current operations against time available for a transformation initiative.
- A trainer can use the single hourglass callout slides to explain prioritization, task sequencing, and the cost of delayed decisions.
- An operations leader can use the hourglass chart concept to frame capacity, waiting time, or cycle progress during a process review.
Features
- 100% editable presentation template
- Compatible with Microsoft PowerPoint and Google Slides
- Scalable vector shapes, icons and illustrations
- AI-Ready for Microsoft Copilot and Claude
- Instant access and download
Frequently asked questions
Q: How should a presenter explain elapsed time without making the hourglass metaphor feel decorative?
A: Anchor each hourglass to a specific decision: time already spent, time remaining, or action needed now. Use the percentage slides for measurable progress and the callout slides for causes or consequences. Keep labels short so the audience reads the visual as a status signal, not as background art.
Q: Who is this template best suited for in a business presentation?
A: It is best for project managers, consultants, team leads, and trainers who need to discuss urgency, deadlines, progress, or time allocation. The hourglass metaphor works especially well when the message depends on contrast, such as remaining time versus consumed time, or planned effort versus actual progress.
Q: Why use repeated hourglass percentages instead of a standard timeline?
A: A timeline shows order, while the hourglass shows depletion and urgency. The repeated 0%, 25%, 50%, 75%, and 100% layouts make progress feel physical, because sand visibly moves from the top to the bottom. This metaphor helps audiences grasp time pressure faster than a date-only diagram.


Hourglass of Time Shapes for PowerPoint
6-slide PowerPoint presentation template with hourglass shapes, percentage diagrams, and time management visuals
Hourglass of Time Shapes for PowerPoint is a 6-slide PowerPoint shape template for explaining time management, project timing, and remaining effort. It includes a cover with three hourglasses, single hourglass callouts, percentage progression diagrams, and opposite hourglass comparison layouts for project managers, consultants, trainers, and operations teams.


 Loading...
 Microsoft PowerPoint
 Microsoft Copilot
 Claude for PowerPoint
Other formats supported
Subscribe today and get immediate
access to download our PowerPoint templates.