Graphic Equalizer Shapes for PowerPoint
Apply the Graphic Equalizer Shapes for PowerPoint for showing different key performance indicators. Create attractive slides using interactive graphics and the equalizer analogy.
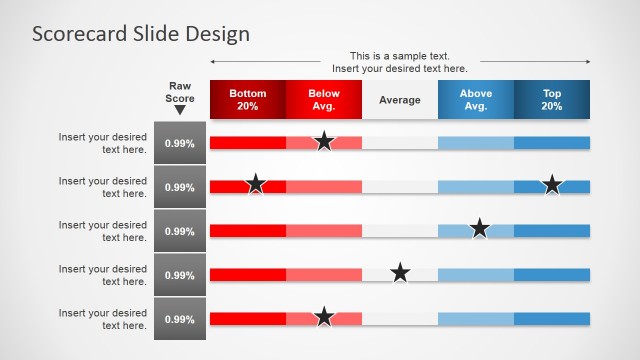
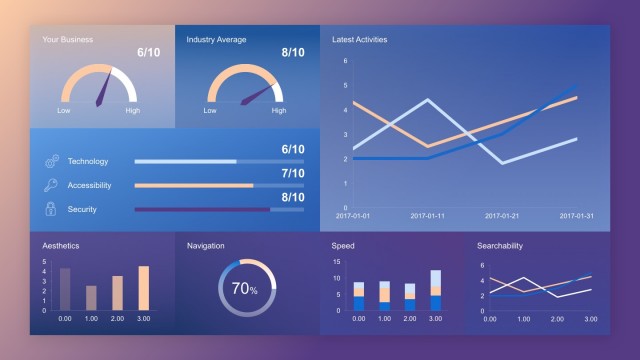
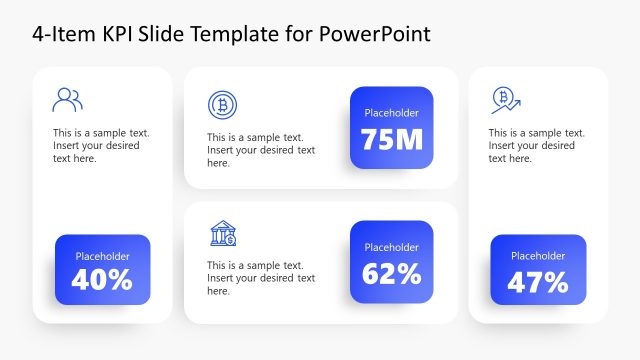
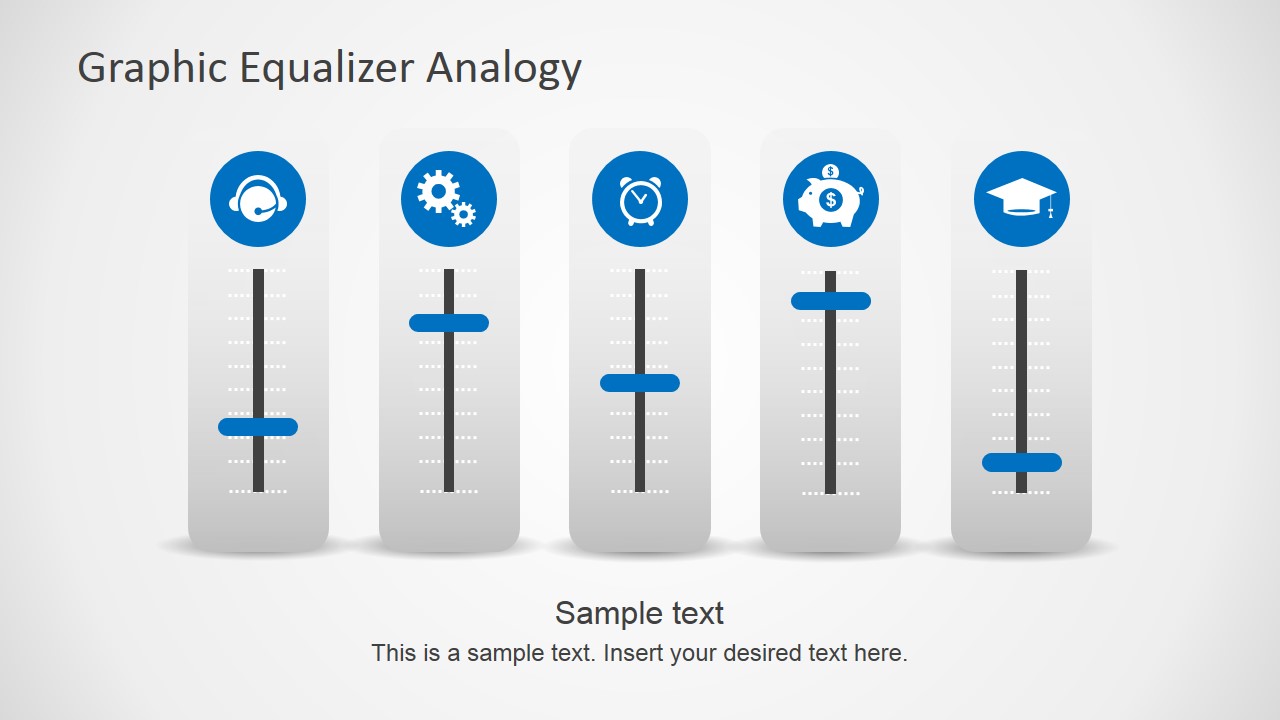
The presenter can create an interesting infographic using the graphic equalizers. Each marker can act as editable column charts. Show and compare simple KPI’s across several dimensions. The equalizers can represent various areas of interest in a company. The user can describe relative levels of priority and amount of resources put into each area. This allows the management to gauge the allocation of funds and materials.
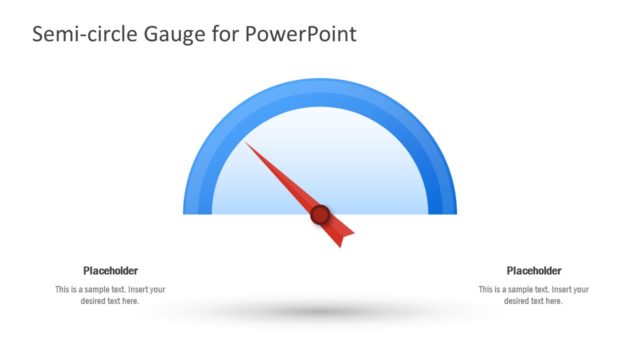
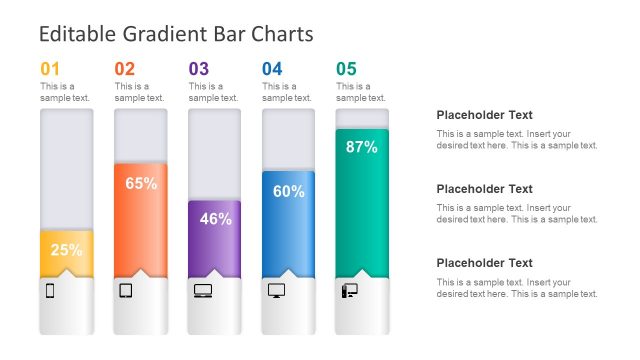
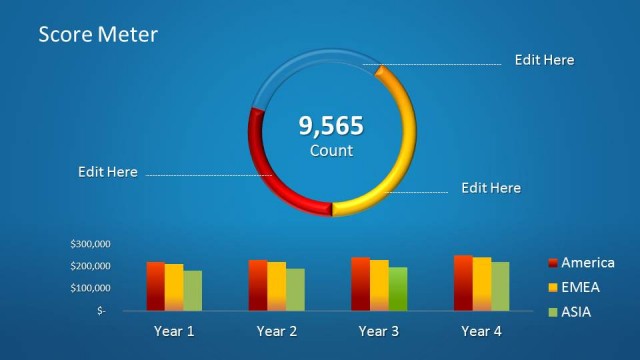
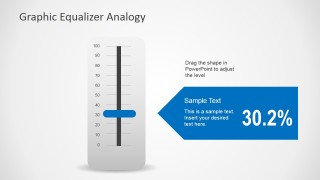
The equalizer graphics are open to adjustment. Take advantage of this feature by using the slides as a metaphor for different statistical data. These can range from allocation of financial assets, to length of assigned time periods. The position of the slider on the gauge corresponds to the indicator data related to the presenter component. The user can move the sliders and adjust them to match their respective values. The flexibility of the PowerPoint graphics can be emphasized by showing the effects of moving the position or percentage of effort on one equalizer to the others.
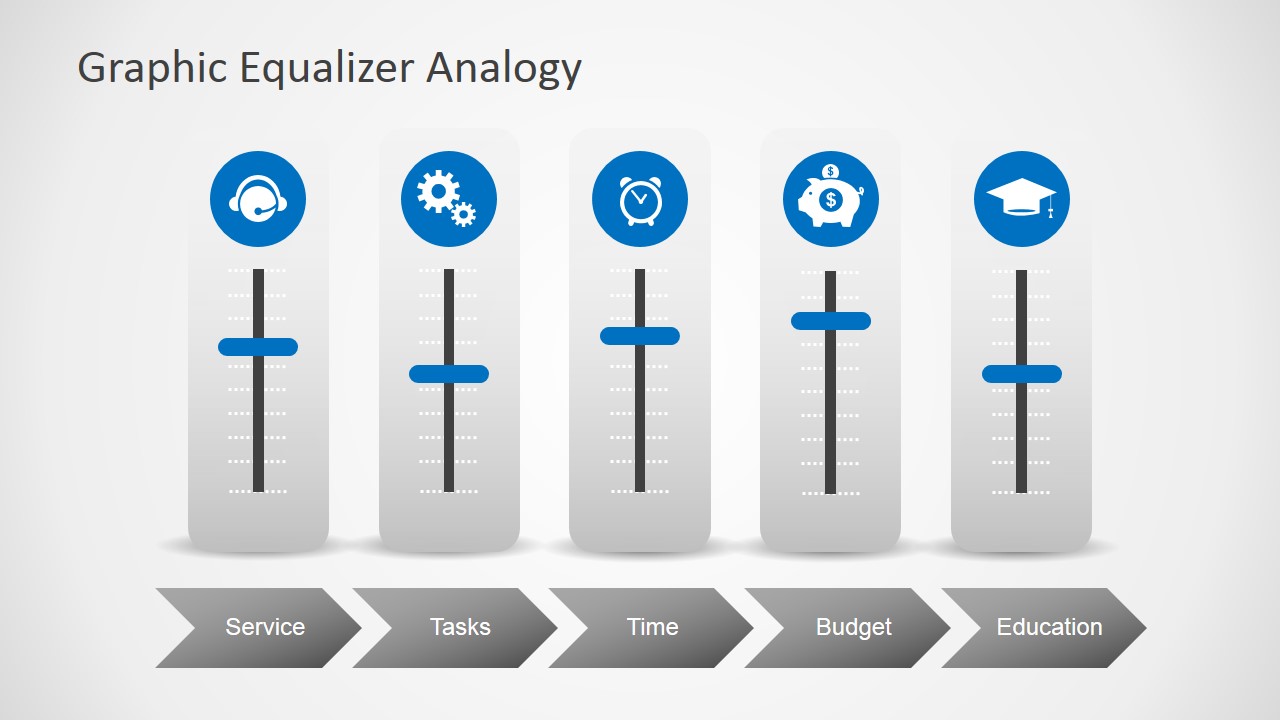
The PowerPoint slide contains a composite slide with five equalizers placed side by side. This provides a greater visibility and exposure for the different elements presented in the slide. By showing an overview of the five elements and their respective information, the viewers can compare performance between the indicators. This design allows management to properly analyze the information, and adjust their leadership and management practices accordingly to compensate for different situations.
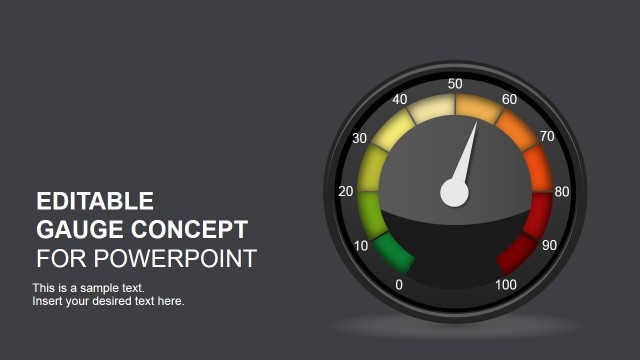
With the use of the Graphic Equalizer Shapes for PowerPoint, the presenter can edit and revise the position and content of the slide design. The PowerPoint objects are 100% customizable to allow the presenter to adapt them to a particular theme. The presenter can include further PowerPoint Shapes or combine different PowerPoint Templates, downloadable from our Gallery, such as the Gas Gauge PowerPoint Shapes.

You must be logged in to download this file.
DOWNLOAD- Category
- Shapes
- Rating


 Loading...
- Size
- 16x94x3
- Item ID
- 6962-01
- Colors
Subscribe today and get immediate
access to download our PowerPoint templates.