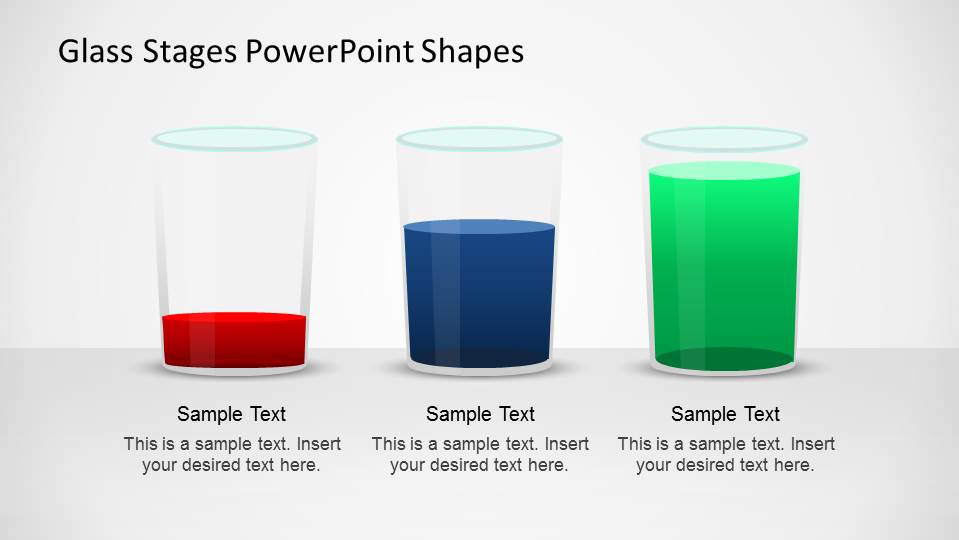
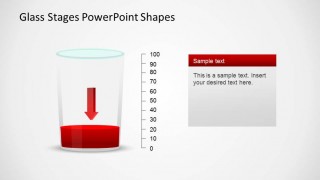
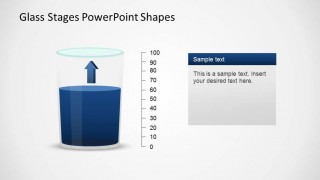
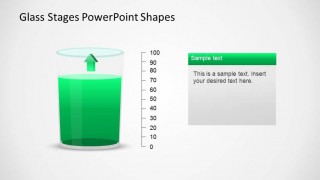
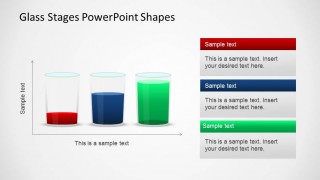
Glass Stages PowerPoint Shapes is a creative Staged Diagram using the metaphor of the glass half empty or half full. In this presentation the user can identify concepts to three different glasses identified by colors red, blue, green. Each glass can have different levels of liquid inside, that represent the value of the concept.
The glasses and it content is created using PowerPoint Shapes, so is fully editable. The user can edit, and adapt this presentation or reuse the shape sin existing presentations.
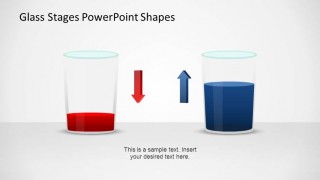
The presentation provides different usages of the glasses, also combining them with cartesian axes to relate the fill with a numeric value. Also it provides one slide for each glass with a color matching PowerPoint Arrow that represents the tendency.
Combine the creative Glass Stages PowerPoint Shapes with additional shapes of our catalog, and create amusing presentation that appeal to professional audiences.
What’s inside this template
Example presentation scenarios
- A project manager can compare low, medium, and high completion states using the three-glass comparison layout and then explain each stage with the individual percentage scale slides.
- A sales leader can present pipeline health by mapping weak, moderate, and strong categories to the red, blue, and green glass fills with matching callout panels.
- A consultant can explain stakeholder sentiment by using the down and up arrow slides to show negative and positive tendencies in a client workshop.
- A product manager can summarize feature adoption levels with the 0-100 scale layouts, using the glass fill as a quick visual cue before discussing supporting text.
Features
- 100% editable presentation template
- Compatible with Microsoft PowerPoint
- 16:9 aspect ratio slides
- Scalable vector shapes, icons and illustrations
- AI-Ready for Microsoft Copilot and Claude
- Instant access and download
Frequently asked questions
Q: How can I make the glass metaphor clear without overexplaining it?
A: Start by defining what the fill level represents, such as progress, risk reduction, adoption, or confidence. Use the three-glass comparison slide to set the scale, then move to the single-glass slides only for the categories that need explanation. Keep the text panels short so the liquid level remains the primary meaning.
Q: When is this template a better choice than a standard bar chart?
A: This template fits situations where the audience needs a memorable status signal rather than exact analytical detail. It works well for executives, clients, or workshop groups comparing a few states such as low, medium, and high. The arrows and glass levels communicate direction and intensity faster than dense chart labels.
Q: Why do the layouts combine glass fills, arrows, and percentage scales?
A: The glass fill gives the audience an immediate metaphor for quantity or readiness, while the arrows add movement and direction. The 0-100 scale gives the metaphor a numeric reference without turning the slide into a full chart. This combination helps presenters connect emotion, status, and measurement in one view.


Glass Stages PowerPoint Shapes
6-slide presentation template with glass fill stages, comparison arrows, and percentage axis diagrams
Glass Stages PowerPoint Shapes is a 6-slide diagram template for presenting staged values with glass-half-full visuals. It includes three-glass comparison layouts, up and down tendency arrows, 0-100 percentage axis diagrams, and stacked callout panels. Business presenters can use the editable PowerPoint shapes to compare status, volume, sentiment, or progress.
- Category
- Shapes
- Rating


 Loading...
- Aspect ratio
- 16:9
- Item ID
- 6502-02
- Colors
 Microsoft PowerPoint
  Microsoft Copilot
  Claude for PowerPoint
 Other formats supported
Subscribe today and get immediate
access to download our PowerPoint templates.