Slide 1 of 1 from Flat Donut Target Design for PowerPoint
Flat Donut Target Chart in PowerPoint
Donut Target Design for Presentations
- Diagram
- Other
- Evaluation Slide
- 16:9
- 100% Editable
What’s on This Slide
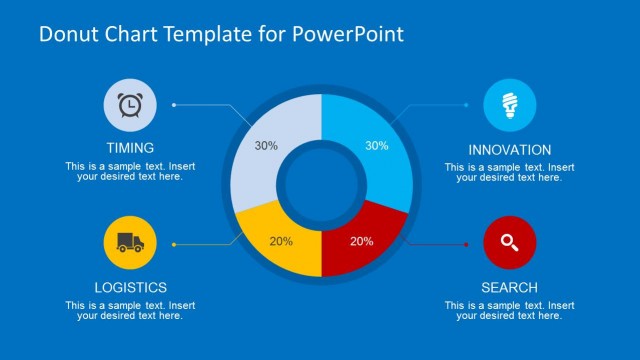
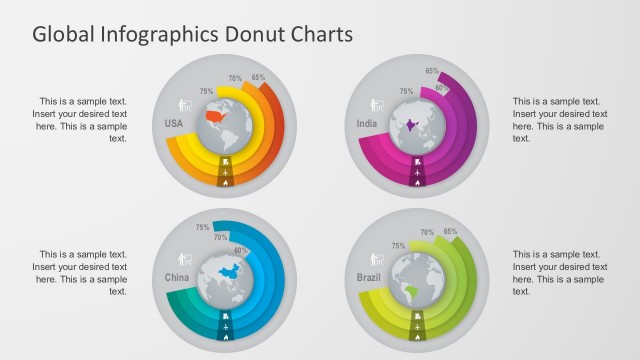
The layout features a central donut chart with four concentric rings, each representing a percentage value. The outermost ring is colored in shades of gray, yellow, and blue, while the inner rings are white and gray. Each segment has a corresponding percentage label positioned outside the chart, aligned with connecting lines. Text placeholders are located near each percentage, indicating where additional information can be inserted. The title is centered at the top, and the background is a solid light blue, creating a clear visual hierarchy.
How to Use It
This layout serves as a percentage breakdown tool, ideal for illustrating data distribution in a business context. It fits well in presentations discussing performance metrics, market segmentation, or project progress. The donut chart format allows for easy comparison of different categories. Use this design when needing to present quantitative data visually, particularly when emphasizing proportions or targets. It is suitable for both standalone presentations and as part of a larger analytical report.
Text Placeholders & Capacity
Keep your copy within these limits so it fits without resizing. Node labels are tight, roughly 5 characters each.
| Placeholder | Count | Max characters (approx.) |
|---|---|---|
| Slide title | 1 | 30 |
| Item heading | 4 | 5 |
| Item body | 4 | 50 |
Slide Keywords
Download unlimited PowerPoint templates, charts and graphics for your presentations with our annual plan.
DOWNLOADReturn to Flat Donut Target Design for PowerPoint.