COBIT 7 Phases PowerPoint Diagram
The COBIT 7 Phases PowerPoint Diagram is an information technology framework to demonstrate infrastructure analysis. In general, the management professionals can use this presentation for strategic business planning. The COBIT (COntrol Objectives for Information and relevant Technology) is IT governance and management framework. In fact, it is a business optimization tool influence by positive results of organizational practices. Empowering businesses through innovation in IT for exceeding success. Conversely, ISACA is information audit and control organization, created model for better management of any company’s technology processes. Therefore, the model supports gap between technical and business requirements. It is a global framework adapt by managers worldwide to ensure proper working of IT processes. Basically, it ensures quality control and reliability of organization’s IT infrastructure.
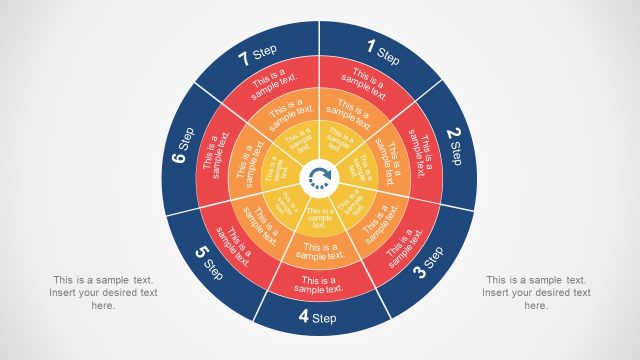
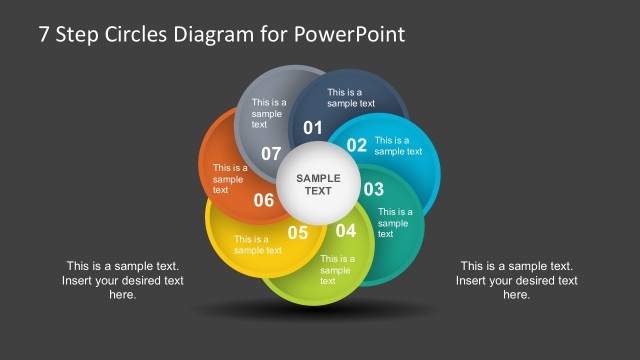
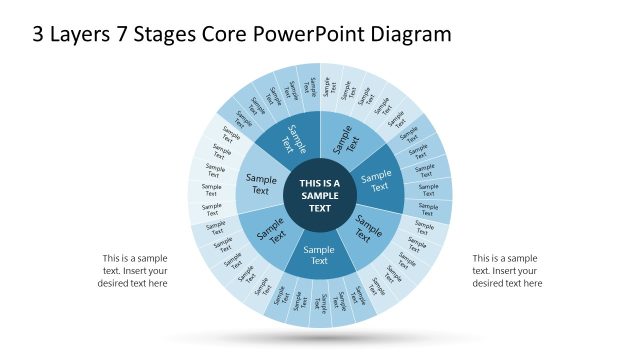
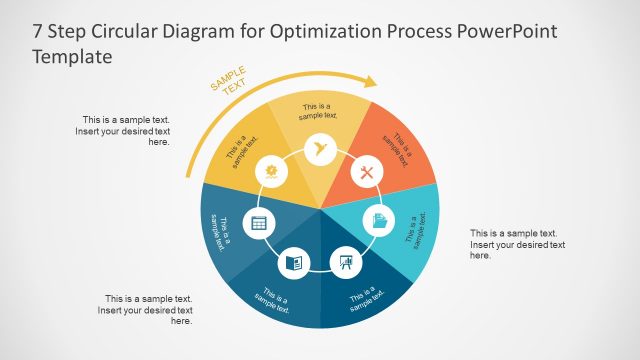
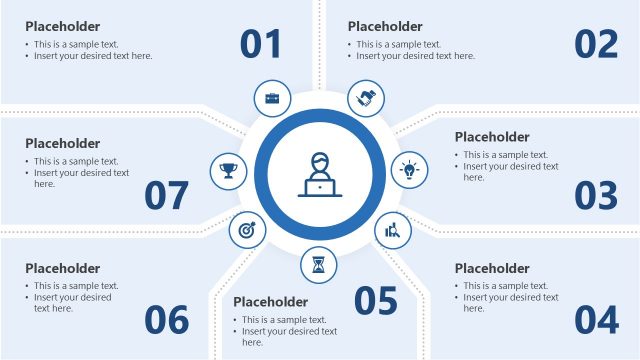
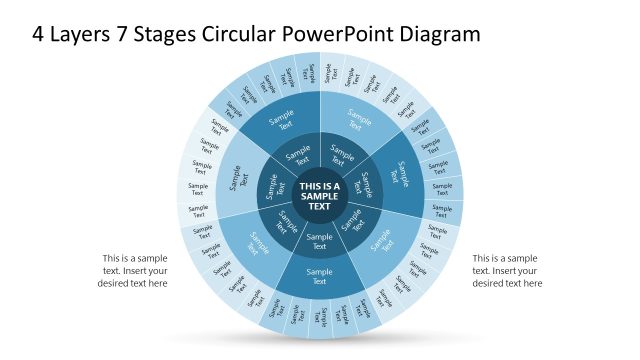
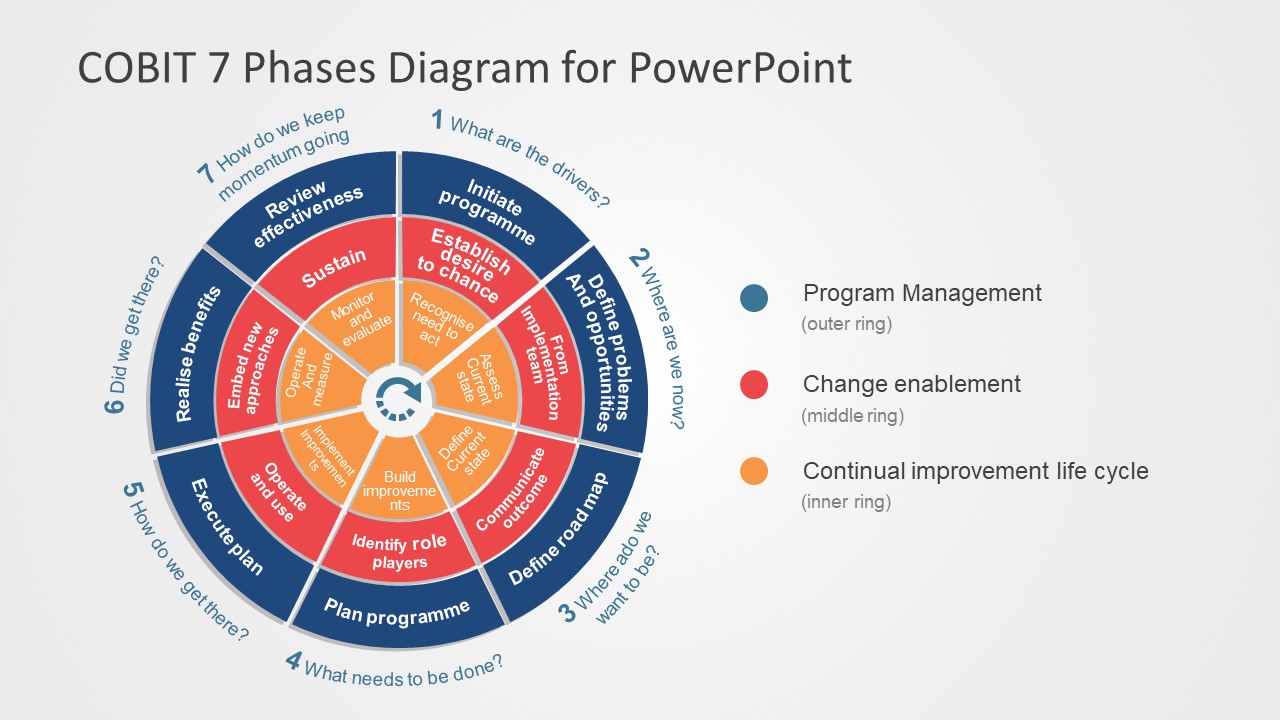
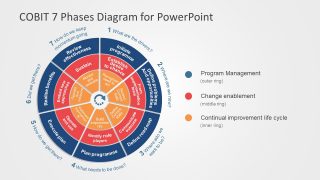
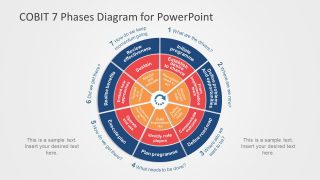
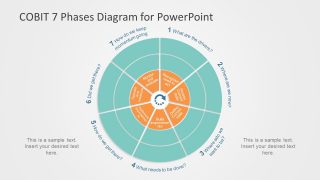
The COBIT 7 Phases PowerPoint Diagram is a template of five multi-layer circular diagram slides. The implementation process of COBIT has following 7 phases in the lifecycle, as appear in PowerPoint template.
- What Are the Drivers? – Initiate problem
- Where Are We Now? – Analyze drivers for change
- Where Do We Want to Be? – Roadmap
- What Needs to Be Done? – Plan improvements
- How Do We Get There? – Execute Plan
- Did We Get There? – Evaluation of results
- How Do We Keep the Momentum Going? – Review Effectiveness
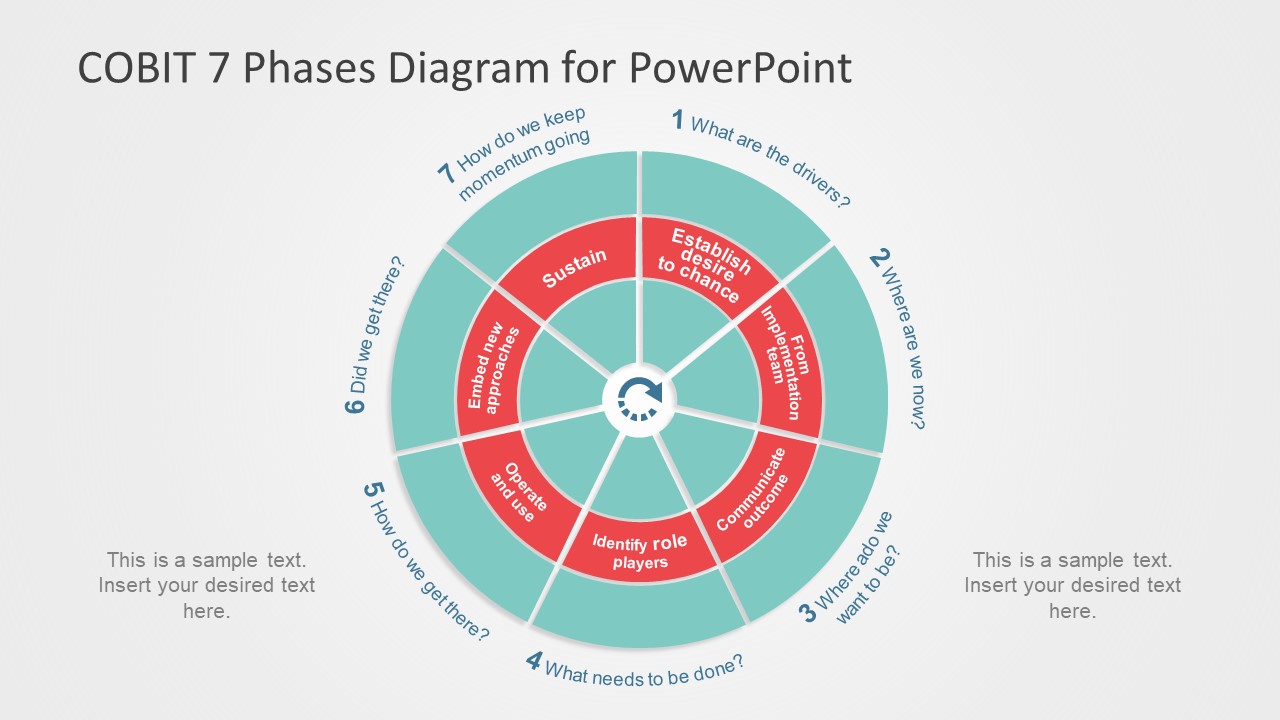
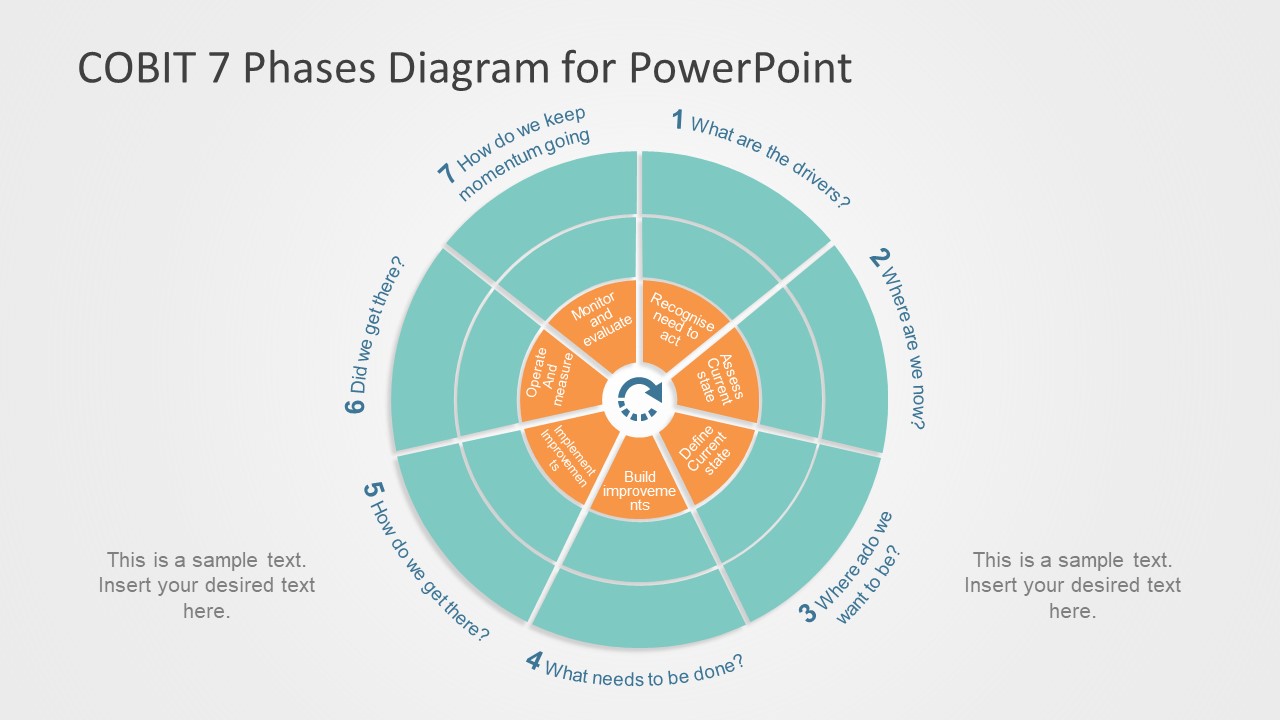
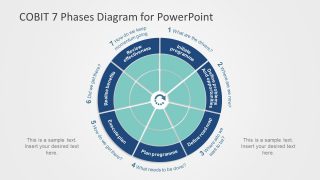
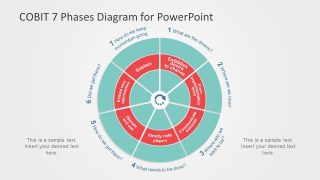
The three-layer diagram of COBIT 7 Phase PowerPoint explain distinct process of seven sub processes. The outer ring is a program management segment, the big picture. Further, narrows down to change through execution. Whereas, last segment defines the audit and continues improvement. The circular arrow icon in the middle is a metaphor of loop/repeating processes. The first two slides display a complete diagram of all the visible activities. However, the next three contain data of one segment each while hiding the other two sections. This helps audience to concentrate one major operation at a time. The editable PowerPoint shapes enable users to modify several features of template. Such as, colors, icons, font or replacing text placeholders. The COBIT diagram PowerPoint of 7 phases is suitable for professionals of business and technology industry. The organizations can present awareness and sensibility of IT infrastructure.


You must be logged in to download this file.
DOWNLOAD- Category
- Diagrams
- Rating


 Loading...
- Size
- 16x94x3
- Item ID
- 7506-02
- Colors
Subscribe today and get immediate
access to download our PowerPoint templates.