Slide 1 of 3 from Before & After Process Optimization Slide PowerPoint Template
Before & After Process Optimization Presentation Template
Before and After Process Optimization Slide
- Diagram
- Comparison Split
- Process Slide
- 16:9
- 100% Editable
The Before and After Process Optimization slide from the Before & After Process Optimization Slide PowerPoint Template offers a clear comparison layout ideal for business presentations. This slide template uses editable shapes and vector icons to visually demonstrate process improvements and performance changes, making it suitable for corporate presentations and pitch decks that require a professional slide deck to highlight transformations effectively.
What’s on This Slide
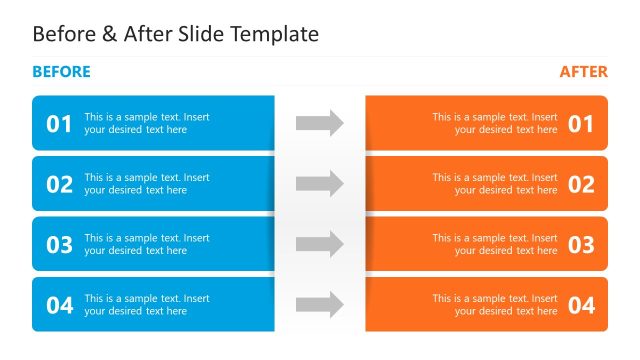
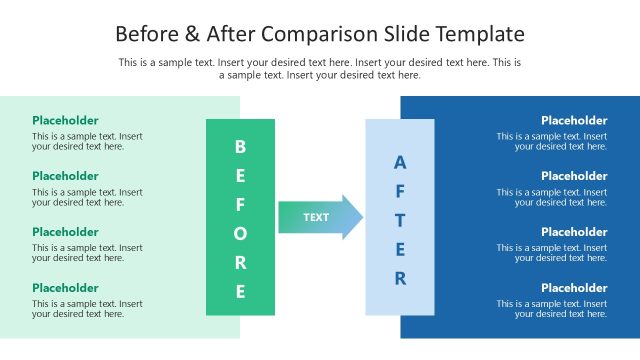
The layout features a circular shape on the left labeled 'BEFORE' and another circular shape on the right labeled 'AFTER.' Between these circles are two rectangular shapes labeled 'FIRST HALF' and 'SECOND HALF,' arranged in a horizontal sequence. Each section contains text placeholders aligned centrally, with the left and right sections having a light blue and light green background, respectively. The overall composition is linear, guiding the viewer from the 'BEFORE' state to the 'AFTER' state, emphasizing a process flow. The visual hierarchy is clear, with prominent labels and distinct sections.
How to Use It
This layout serves as a comparative infographic, illustrating a process change or optimization over time. It fits well in presentations that aim to highlight improvements or transformations, such as in business performance or product development. This structure is useful for showcasing before-and-after scenarios, making it ideal for case studies, project updates, or performance reviews. It can be used to succinctly convey the impact of changes in various business contexts.
Text Placeholders & Capacity
Keep your copy within these limits so it fits without resizing. Node body slots can hold around 10-12 words each.
| Placeholder | Count | Max characters (approx.) |
|---|---|---|
| Slide title | 1 | 40 |
| Item heading | 4 | 20 |
| Item body | 4 | 60 |
Slide Keywords
Download unlimited PowerPoint templates, charts and graphics for your presentations with our annual plan.
DOWNLOADReturn to Before & After Process Optimization Slide PowerPoint Template.