Slide 9 of 10 from Beat the Market PowerPoint Template
Beat the Market PowerPoint Template – Data Driven Chart
Data Visualization Slide for Business Presentations
- Chart
- Line Chart
- Evaluation Slide
- 16:9
- 100% Editable
What’s on This Slide
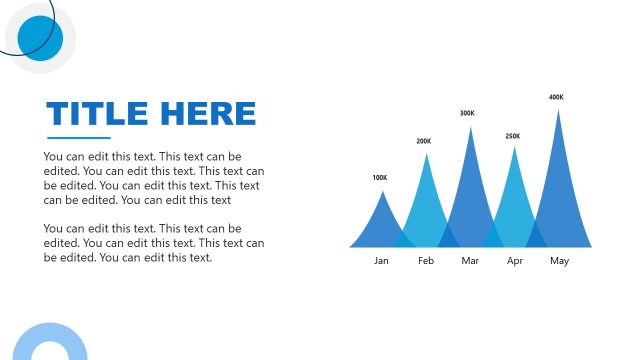
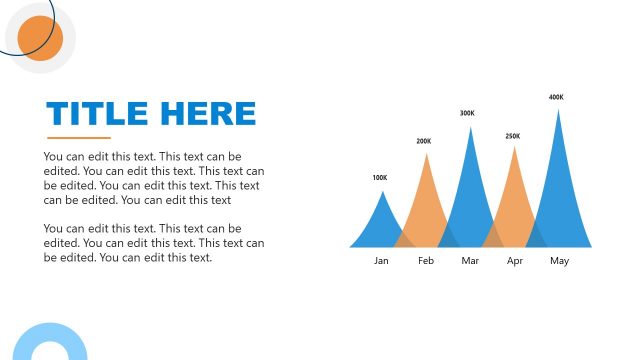
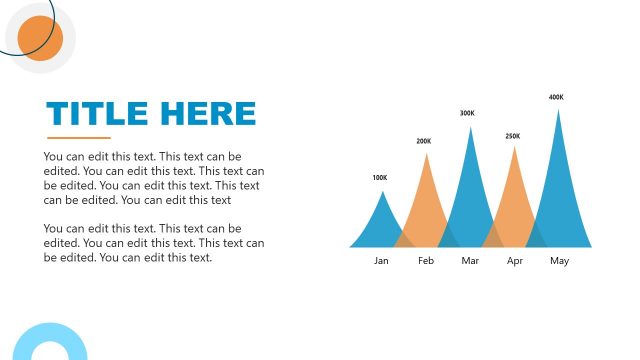
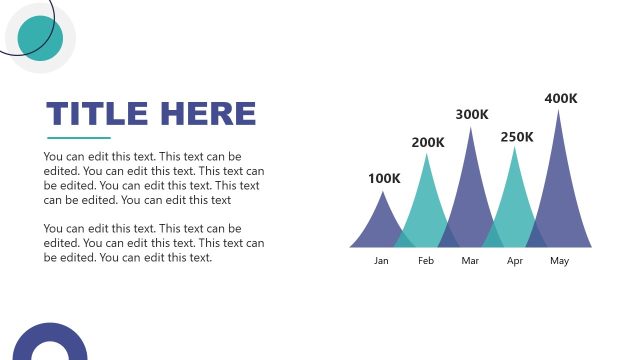
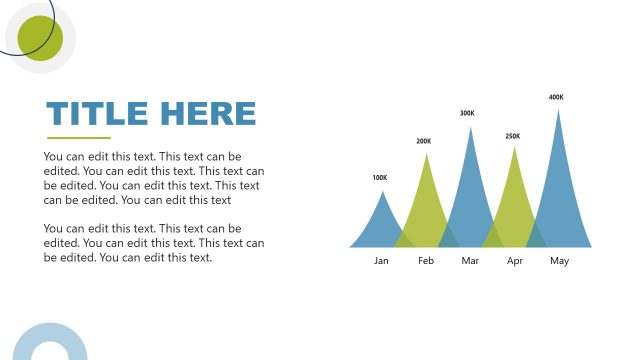
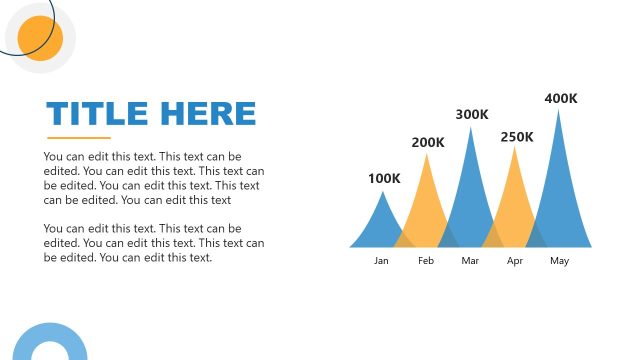
The layout features a large title placeholder at the top left, with a bold font. Below the title, there are multiple text placeholders arranged vertically, aligned left. To the right, a chart displays a series of peaks representing data over five months, with labeled axes. The peaks are in varying shades of blue, creating a gradient effect. The x-axis lists the months, while the y-axis shows values in thousands. The overall composition balances text on the left with a visual representation on the right, emphasizing clarity and focus.
How to Use It
This layout serves as a data visualization slide, ideal for presenting trends or performance metrics. It fits well in a presentation sequence following problem identification and before strategic recommendations. This structure is useful in business contexts such as quarterly reports, sales forecasts, or market analysis, where clear data representation is essential for decision-making. It allows for effective communication of numerical data through visual peaks, making it easier for the audience to grasp key insights quickly.
Text Placeholders & Capacity
Keep your copy within these limits so it fits without resizing. Body slots are tight, roughly 10 words each.
| Placeholder | Count | Max characters (approx.) |
|---|---|---|
| Slide title | 1 | 30 |
| Body paragraph | 5 | 50 |
| Chart title | 1 | 20 |
| Axis label | 2 | 10 |
| Data label | 5 | 10 |
Slide Keywords
Download unlimited PowerPoint templates, charts and graphics for your presentations with our annual plan.
DOWNLOADReturn to Beat the Market PowerPoint Template.