Slide 1 of 1 from Aqua Dashboard PowerPoint Template
Editable Aqua Dashboard Presentation Template
Aqua Dashboard Data Visualization Slide
- Chart
- Dashboard Composite
- Kpi Reporting Slide
- 16:9
- 100% Editable
The Data Visualization Dashboard slide from the Aqua Dashboard PowerPoint Template offers a clear layout for presenting key performance indicators and trends. This slide template is designed for business presentations, enabling concise communication of project status updates and marketing campaign results through editable shapes and vector icons. Its structured design supports effective KPI reporting within a corporate presentation or pitch deck template.
What’s on This Slide
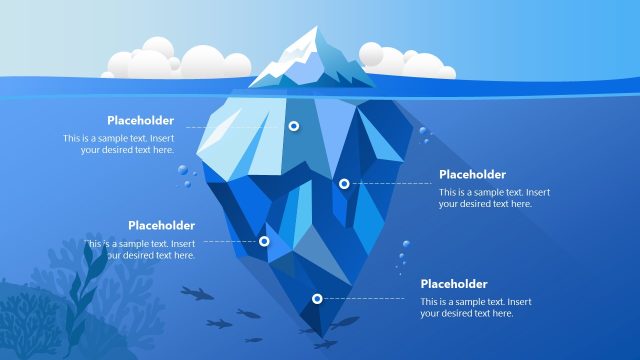
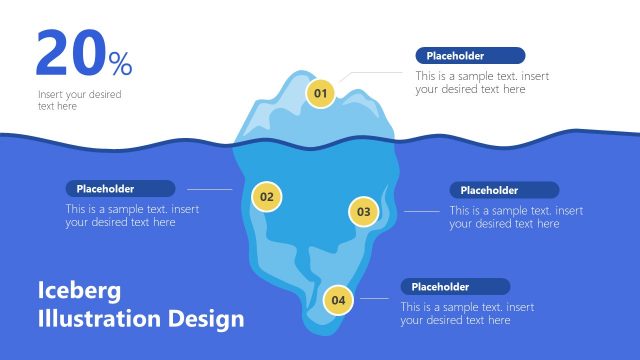
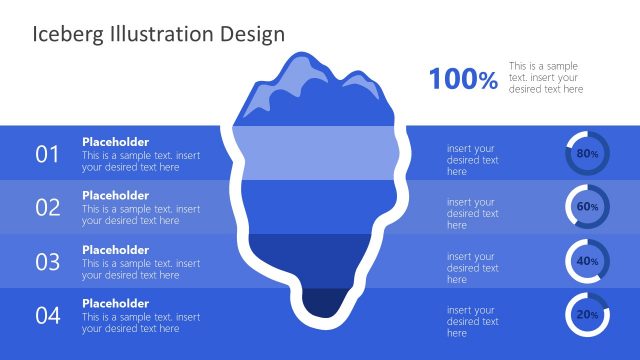
The slide features a large iceberg graphic positioned centrally, with a percentage label of 21% at the top. Below, there are three percentage indicators: 79%, 88%, and 55%, each accompanied by text placeholders aligned to the left. A line chart is placed in the upper right corner, showing a trend over time. In the lower right, a bar chart displays two categories, labeled Category 1 and Category 2. The background is a gradient of blue tones, enhancing the aquatic theme. All elements are organized to maintain a clear visual hierarchy.
How to Use It
This layout serves as a data visualization dashboard, ideal for presenting key performance indicators and trends. It fits well in a presentation sequence following an overview or introduction, effectively summarizing data insights. Business scenarios include quarterly performance reviews, project status updates, or marketing campaign results. This layout allows for quick comprehension of multiple metrics at a glance, making it suitable for executive summaries or stakeholder briefings.
Text Placeholders & Capacity
Keep your copy within these limits so it fits without resizing. Node body slots are tight, roughly 8 words each.
| Placeholder | Count | Max characters (approx.) |
|---|---|---|
| Item body | 3 | 40 |
| Chart title | 1 | 30 |
| Axis label | 2 | 20 |
Slide Keywords
Download unlimited PowerPoint templates, charts and graphics for your presentations with our annual plan.
DOWNLOADReturn to Aqua Dashboard PowerPoint Template.