Slide 2 of 4 from Analytics Dashboard PowerPoint Template
Analytics Email Marketing Dashboard PPT
Email Subscribers Dashboard Overview
- Chart
- Bar Vertical
- Statistics Slide
- 16:9
- 100% Editable
What’s on This Slide
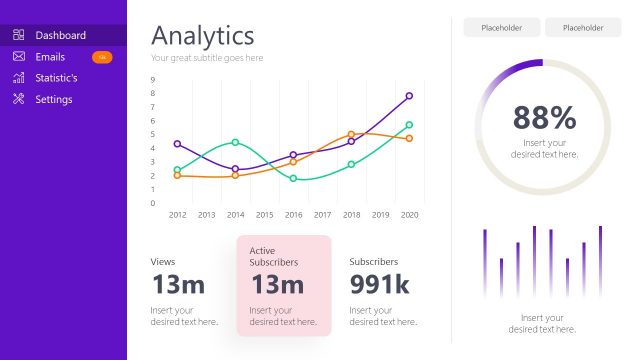
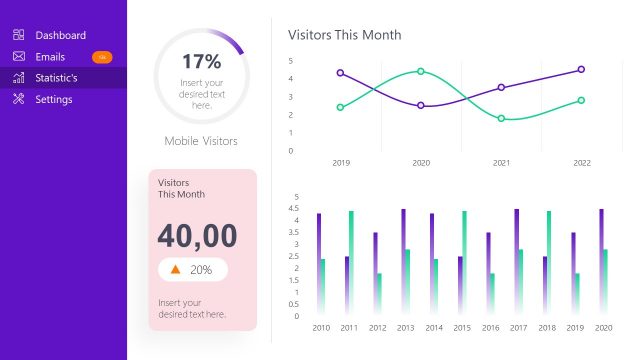
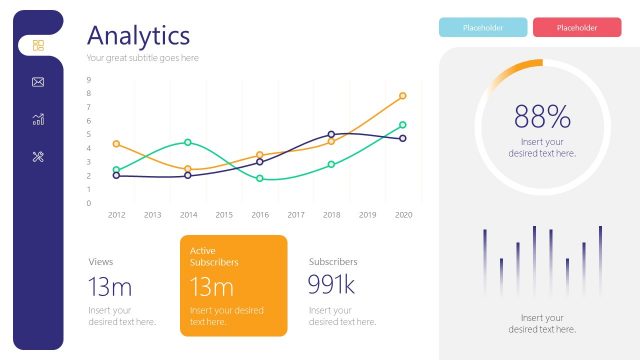
The layout features a left sidebar with navigation icons and a main content area. The main section displays the title 'Email Subscribers' at the top, followed by a subtitle placeholder. Below, a statistics table presents data on active subscribers, unsubscribes, and bounces. A bar chart visualizes new subscribers over months, with vertical bars in a gradient purple. On the right, key metrics are highlighted in boxes, showing new active subscribers and other statistics. Text placeholders are present for additional details and captions.
How to Use It
This layout serves as a dashboard for tracking email subscriber metrics, fitting well after an overview slide in a presentation. It is suitable for business contexts like marketing performance reviews or analytics discussions. The structure allows for clear data presentation and visual comparison of subscriber trends. Use it to convey insights on subscriber growth and engagement metrics effectively, ensuring the audience understands key performance indicators.
Text Placeholders & Capacity
Keep your copy within these limits so it fits without resizing. Text slots have moderate capacity, suitable for concise data presentation.
| Placeholder | Count | Max characters (approx.) |
|---|---|---|
| Slide title | 1 | 30 |
| Subtitle | 1 | 50 |
| Item heading | 12 | 10 |
| Body paragraph | 4 | 20 |
| Chart title | 1 | 30 |
Slide Keywords
Download unlimited PowerPoint templates, charts and graphics for your presentations with our annual plan.
DOWNLOADReturn to Analytics Dashboard PowerPoint Template.