Slide 12 of 13 from Altius Business Presentation Template
Sales & Revenue Discussion Slide – Altius Business Profile Layout
Sales & Revenue Overview Slide
- Chart
- Bar Vertical
- Financial Summary Slide
- 16:9
- 100% Editable
What’s on This Slide
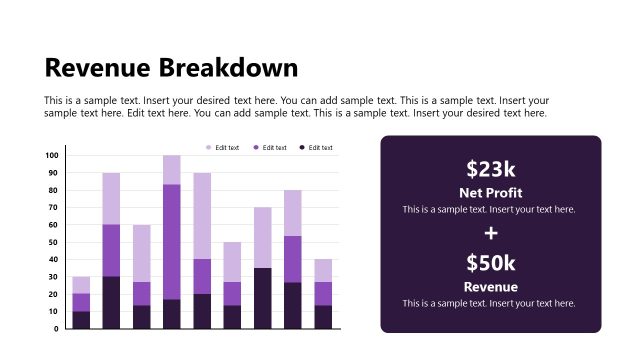
The layout features a left-aligned image of a building, occupying the top half of the slide. Below the image, three text placeholders are arranged vertically, each containing financial metrics: total revenue, total expense, and total customers. These placeholders are left-aligned and have a clear hierarchy, with larger font sizes for the metrics. On the right side, a vertical bar chart displays financial data over the years 2022 to 2025, with bars in varying shades of blue. The background is predominantly white, enhancing readability.
How to Use It
This layout serves as a financial overview, ideal for presenting sales and revenue data. It fits well in a business presentation sequence, especially after discussing company performance or strategic goals. Use it to summarize key financial metrics and trends, making it suitable for quarterly reviews or investor updates. The combination of text and visual data allows for effective communication of financial health and projections.
Text Placeholders & Capacity
Keep your copy within these limits so it fits without resizing. Body slots can accommodate roughly 5-6 words each.
| Placeholder | Count | Max characters (approx.) |
|---|---|---|
| Slide title | 1 | 25 |
| Body paragraph | 3 | 30 |
| Chart title | 1 | 25 |
| Data label | 5 | 10 |
Slide Keywords
Download unlimited PowerPoint templates, charts and graphics for your presentations with our annual plan.
DOWNLOADReturn to Altius Business Presentation Template.