Performance Metrics Slide Template
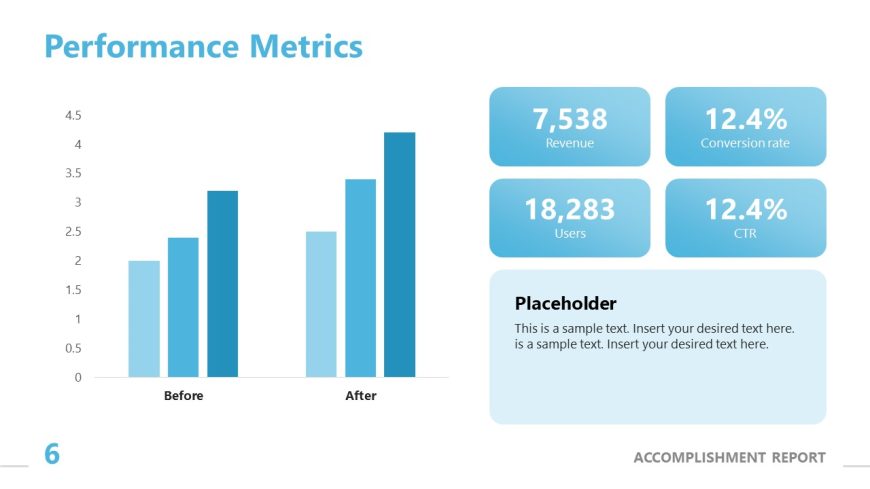
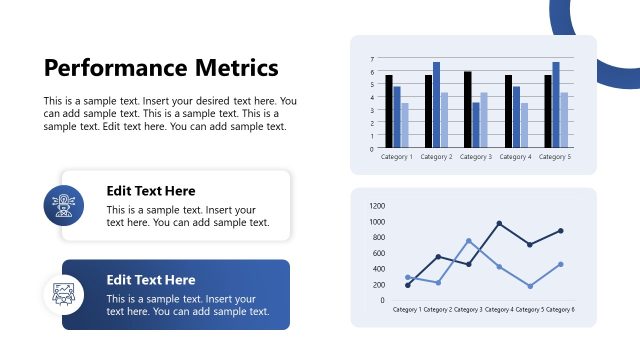
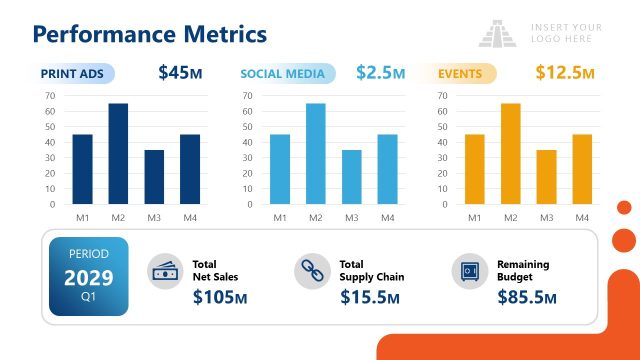
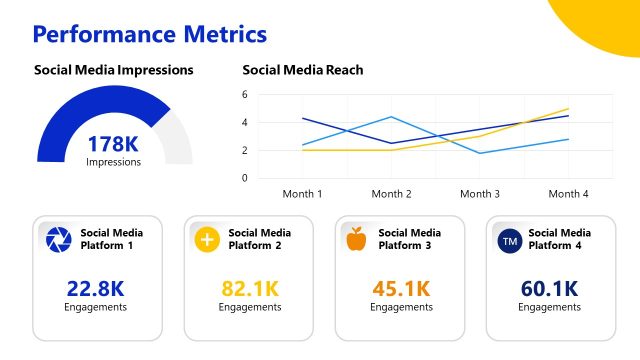
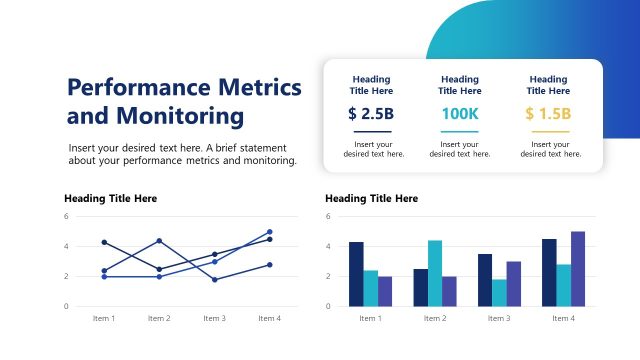
The Performance Metrics Presentation Slide Template is designed to effectively showcase key financial and productivity metrics. The slide features a clean, modern aesthetic, utilizing a gradient of blue tones that symbolize trust and professionalism. The layout is structured with a bar graph on the left, illustrating performance metrics before and after a specific intervention, while the right side presents key statistics such as revenue, conversion rate, and user count in distinct, rounded boxes for clarity.
The bar graph is arranged in a linear fashion, with the ‘Before’ and ‘After’ categories clearly labeled, allowing for easy comparison. The use of straight lines and symmetrical spacing enhances readability and visual appeal. This slide is ideal for presentations in business meetings, investor briefings, or project evaluations, where stakeholders need to grasp performance improvements quickly.
This Performance Metrics Slide is part of the Accomplishment Report PowerPoint Template, which provides a comprehensive framework for presenting organizational achievements. It can also be tailored for various contexts, such as quarterly reviews or strategic planning sessions. The design encourages a logical flow of information, making it easy to narrate the story of growth and success.
Download this slide for PowerPoint & Google Slides presentations, and customize it to meet your specific needs. Whether you’re discussing revenue growth, user engagement, or operational efficiency, this slide will effectively communicate your accomplishments.
Return to Accomplishment Report PowerPoint Template.