8-Item 2-Level Semicircle Diagram for PowerPoint
The 8-Item 2-Level Semicircle Diagram for PowerPoint is designed to represent a multi-stage phenomenon on a single slide. It can help professionals summarize and organize the data and present it using interactive icons. This 2-level diagram effectively elaborates any process divided into two phases, e.g., a research project, implementation process, etc.
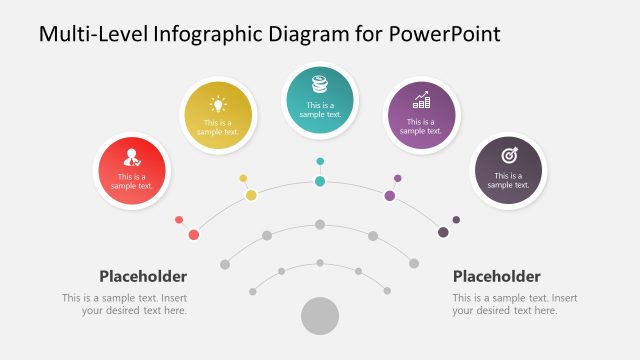
The two-level diagram design has a semicircle illustration placed at the bottom of the slide. The first slide layout contains an 8-item chart divided into two sections (levels) horizontally. The left section is colored blue, while the right one is green. Each level segment represents one of the 8 steps included in the process. The first level shows the steps from 1 to 4, and the second level displays stages from 5 to 8. This is how the whole process can be shown divided into two phases. There are separate boxes for mentioning the step number and adding a short description. Also, the relevant metaphoric icons can be replaced in the outer box of the semicircle.
The second layout of the Semicircle Diagram for PowerPoint is a 4-layer variant diagram. It also has a similar distribution of steps as mentioned above. However, it varies with respect to having a lesser number of events involved in a 2-level process. These schematic diagrams are multi-purpose and can find their applications in versatile domains. For instance, marketers can show the customer sales journey or product development journey process using these diagrams. Similarly, a presentable business plan can also be constructed using this template. This template is an easy-to-use and 100% editable PowerPoint template. Users can easily customize it using PowerPoint, Google Slides, and Keynote.


