5-Step Globe Timeline PowerPoint Template
Create engaging timelines and process steps presentations with our 5-Step Globe Timeline PowerPoint Template. This infographic globe diagram is created using PowerPoint shapes and icons. The globe can be used as a metaphor for global reach, development, or progressive change over years or time. So, business, scientific, or marketing professionals can use this layout for their presentations. The applications of this 5-step globe diagram are not limited to the topics mentioned here; it can be personalized according to other needs. For instance, users can show their career journey or experience timelines using the globe diagram’s creative milestones. Educationists can display the scope of a particular field by changing the clipart icons.
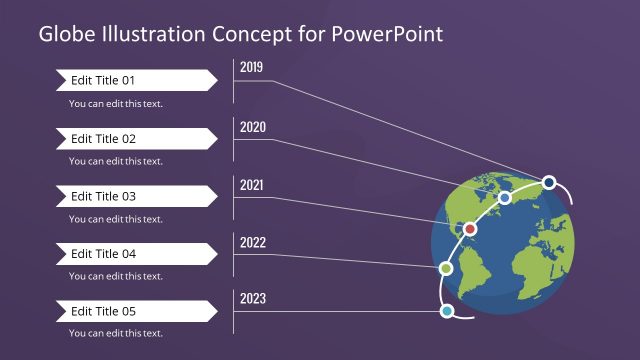
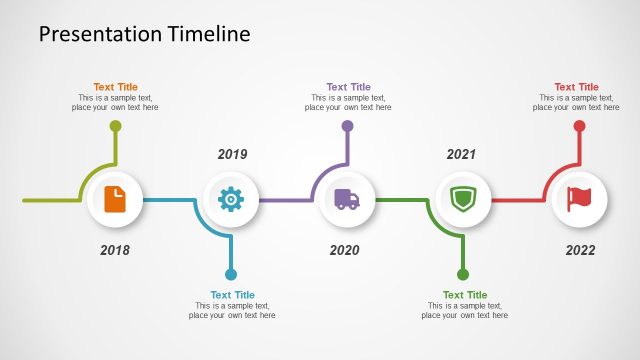
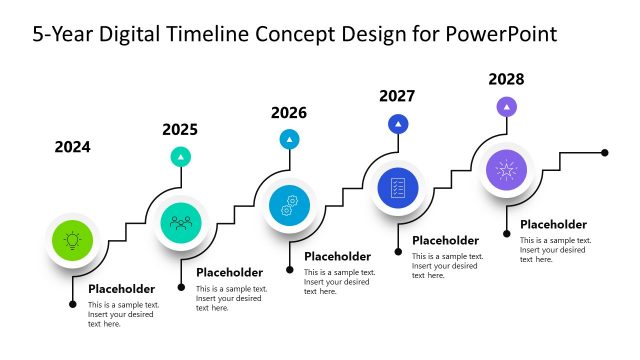
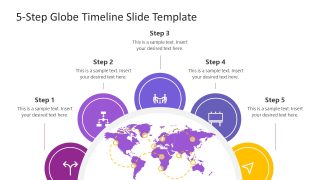
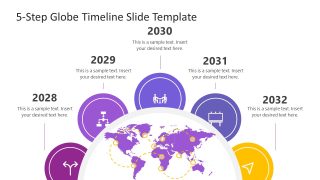
The 5-Step Globe Timeline PowerPoint Template has two PPT slides. These slides vary for the placeholder titles of the milestones, i.e., the first slide shows the step number titles, and the second mentions years. The globe diagram is a semi-circle shape with an editable map in purple. This map is enriched with hap-hazard dotted lines with yellow circular pointers. Using these movable pointers, presenters can relate to some regions on the map. Also, the map can be edited concerning colors and segregation of the constituent segments. Five circular shapes are arranged on the outer side of the globe’s circumference, each one indicating a milestone. These circles are colored in multi-tones of purple and yellow and carry white infographic icons. Presenters can either use the added icons or choose others from the Graphic Tools menu of the PowerPoint toolbar. Above each PowerPoint shape, placeholder text boxes are provided to mention necessary presentation points.
The icons on this PowerPoint template represent the gradual stages of business development or a marketing plan. The double arrow-head symbol, for example, indicates choosing a direction, the flowchart shows the planning phase, and a table sign with two persons on the table represents meetings & discussions. Likewise, the monitor is for the marketing or presentation phase, and the paper plane symbol is to showcase the take-off. So, with this collection of icons, presenters can explain the business models and strategies. Presenters can choose between both slides and edit with all PowerPoint versions, Google Slides, and Keynote.


You must be logged in to download this file.
DOWNLOAD- Category
- Timelines & Planning
- Rating

 Loading...
- Size
- 16x9
- Item ID
- 21710-01
- Colors
Subscribe today and get immediate
access to download our PowerPoint templates.