Slide 6 of 26 from Free SWOT Infographics
Four Sections Colorful Slide SWOT Template
SWOT Analysis Infographic Slide
- Diagram
- Matrix Quadrant
- Strategic Analysis Slide
- 16:9
- 100% Editable
What’s on This Slide
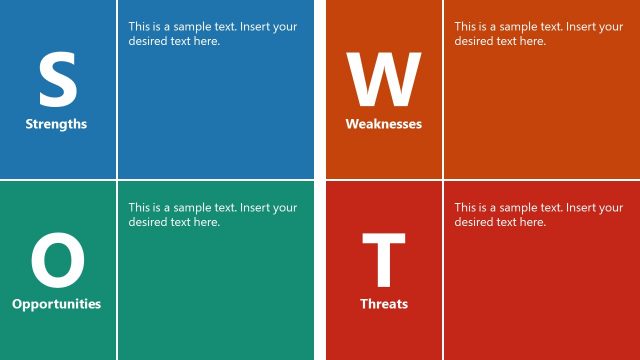
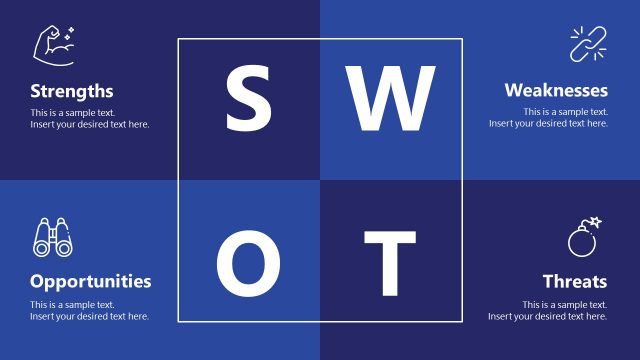
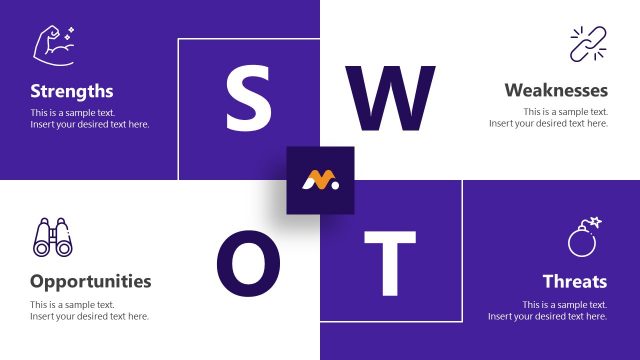
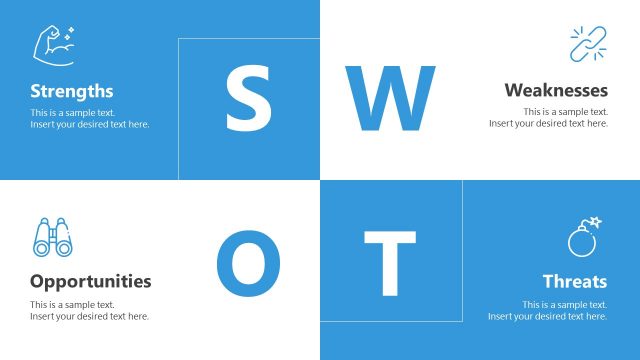
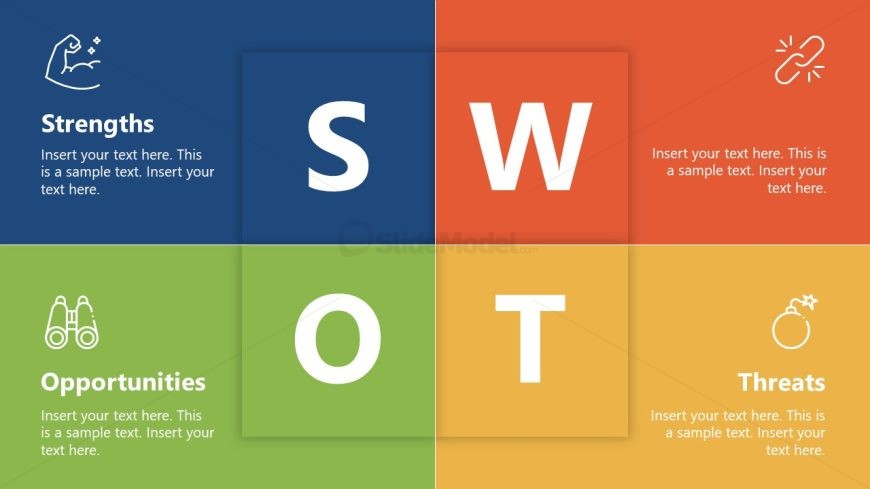
The slide features a four-quadrant layout, each colored differently: blue for Strengths, orange for Weaknesses, green for Opportunities, and yellow for Threats. Each quadrant contains a large letter representing its category, with accompanying text placeholders below for detailed descriptions. Icons are positioned in the top left of the Strengths quadrant and the bottom right of the Threats quadrant. The overall composition is balanced, with clear visual separation between quadrants, enhancing readability and organization. The background is a solid color, contributing to a clean design.
How to Use It
This layout serves as a SWOT analysis tool, ideal for presenting strengths, weaknesses, opportunities, and threats in a structured format. It fits well in a business presentation, particularly when discussing strategic planning or competitive analysis. The quadrant design allows for easy comparison and categorization of key points. This slide is effective in workshops, strategy sessions, or reports where stakeholders need to visualize and discuss these four critical areas.
Text Placeholders & Capacity
Keep your copy within these limits so it fits without resizing. Body slots can accommodate roughly 15-20 words each.
| Placeholder | Count | Max characters (approx.) |
|---|---|---|
| Slide title | 1 | 30 |
| Item heading | 4 | 20 |
| Item body | 4 | 100 |
Slide Keywords
Download unlimited PowerPoint templates, charts and graphics for your presentations with our annual plan.
DOWNLOADReturn to Free SWOT Infographics.