Slide 6 of 13 from Free Marketing Plan PowerPoint Template
Market Size Concentric Circles Diagram Template
Market Size Venn Diagram for Marketing Plan
- Diagram
- Venn
- Context Slide
- 16:9
- 100% Editable
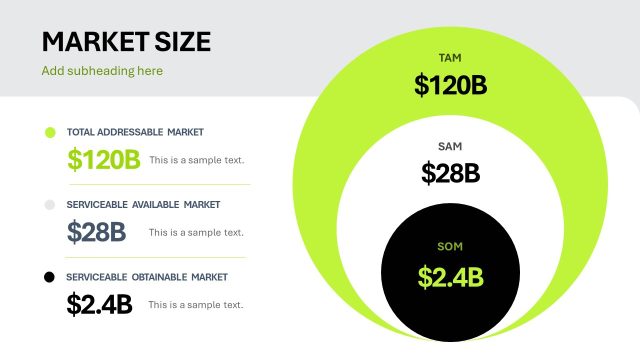
The Market Size Venn Diagram slide from the Free Marketing Plan PowerPoint Template effectively illustrates market segmentation through a clear visual representation of TAM, SAM, and SOM. This slide is ideal for presenting financial forecasts and demonstrating growth potential in a business presentation or pitch deck.
What’s on This Slide
The slide features a Venn diagram with three overlapping circles representing TAM, SAM, and SOM. The largest circle is labeled TAM with a value of $1.9 Bn, positioned at the top. The middle circle, SAM, displays $532M, located below TAM. The smallest circle, SOM, shows $10.6M, placed at the bottom. Each circle has a corresponding label and value aligned horizontally. There are text placeholders for additional descriptions beneath each market size label. The background is light with a subtle dotted pattern, enhancing the visual hierarchy.
How to Use It
This layout serves as a visual representation of market size segmentation, ideal for illustrating Total Addressable Market, Service Addressable Market, and Service Obtainable Market. It fits within a marketing plan presentation, typically following sections that outline goals or target audiences. This slide is useful for businesses to communicate market potential and strategy, especially in investor pitches or strategic planning discussions. It can be used to highlight growth opportunities and market focus areas effectively.
Text Placeholders & Capacity
Keep your copy within these limits so it fits without resizing. Node labels can hold about 10 characters each, while body text can accommodate around 30 characters.
| Placeholder | Count | Max characters (approx.) |
|---|---|---|
| Slide title | 1 | 20 |
| Item heading | 3 | 10 |
| Item body | 3 | 30 |
Slide Keywords
Download unlimited PowerPoint templates, charts and graphics for your presentations with our annual plan.
DOWNLOADReturn to Free Marketing Plan PowerPoint Template.