Slide 3 of 4 from Free Flat Triquetra PowerPoint Diagram
Flat Three Steps Diagram for PowerPoint
Flat Triquetra PowerPoint Diagram
- Diagram
- Comparison Split
- Process Slide
- 16:9
- 100% Editable
The Flat Triquetra Diagram slide from the Free Flat Triquetra PowerPoint Diagram template offers a clear way to present interconnected processes or feature comparisons. This editable slide uses a distinctive three-segment triquetra shape with vector icons and text placeholders, making it suitable for business presentations or strategic overviews. It integrates well into slide decks focused on process explanation or category differentiation, providing a structured visual aid within a professional corporate presentation.
What’s on This Slide
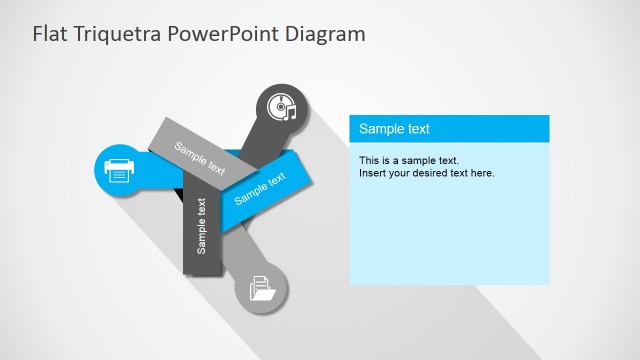
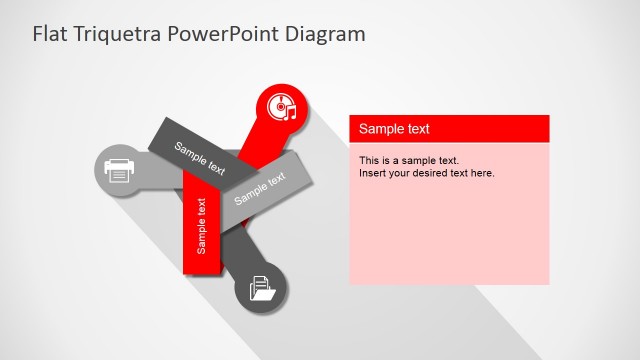
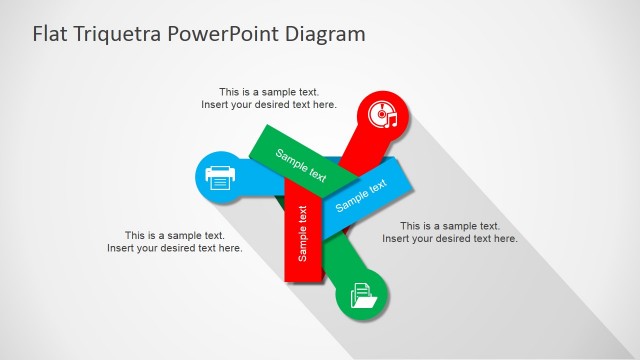
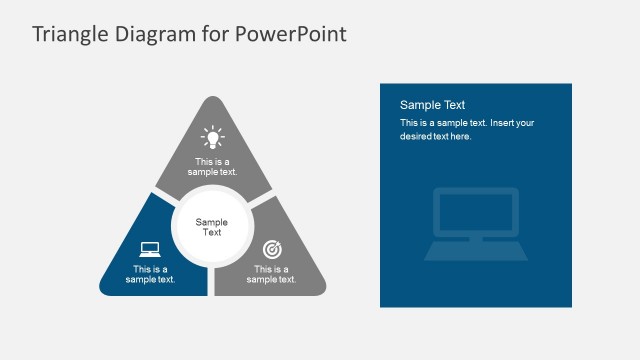
The layout features a central triquetra shape with three overlapping segments. Each segment is a different color: green, gray, and dark gray, with icons representing various concepts. The segments are arranged in a triangular formation, pointing outward. To the right, a rectangular text box is present, containing sample text placeholders. The title is positioned at the top center, and the overall background is light gray. The visual hierarchy emphasizes the triquetra shape, with icons and text placeholders clearly defined.
How to Use It
This layout serves as a process flow or comparison diagram, suitable for illustrating three interconnected concepts or steps. It fits well in presentations discussing strategies, phases, or categories. Ideal for business scenarios like project planning, product features, or service offerings, this structure allows for clear communication of relationships between ideas. It is best used after introductory content to delve into specifics or comparisons.
Text Placeholders & Capacity
Keep your copy within these limits so it fits without resizing. Node body slots can hold around 10 words each, while the body paragraph slot is tighter.
| Placeholder | Count | Max characters (approx.) |
|---|---|---|
| Slide title | 1 | 30 |
| Item body | 3 | 50 |
| Body paragraph | 1 | 150 |
Slide Keywords
Download unlimited PowerPoint templates, charts and graphics for your presentations with our annual plan.
DOWNLOADReturn to Free Flat Triquetra PowerPoint Diagram.