Slide 5 of 5 from Free Creative World Map Slides for PowerPoint
FF0048-01-creative-wordmap-slides-5
Demographic Distribution Slide for Presentations
- Media Layout
- Other
- Statistics Slide
- 16:9
- 100% Editable
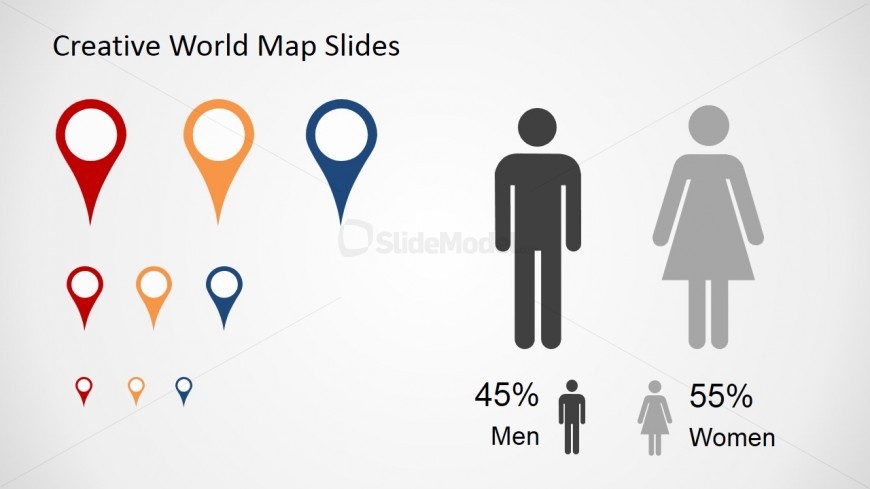
The Demographic Distribution with Icons slide from the Free Creative World Map Slides for PowerPoint template visually represents gender demographics using editable shapes and vector icons. Ideal for business presentations and market analysis, this slide layout enhances audience profiling by combining clear percentage labels with symbolic figures, making it a practical addition to any corporate presentation or pitch deck template.
What’s on This Slide
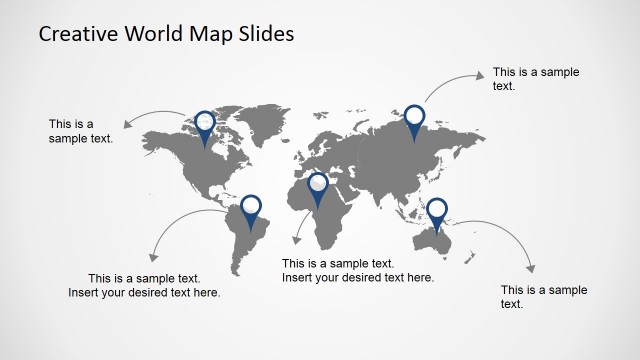
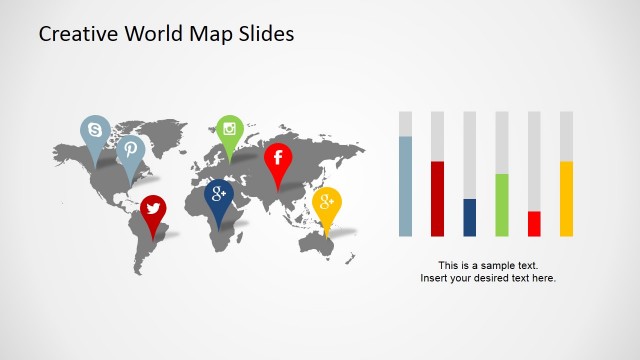
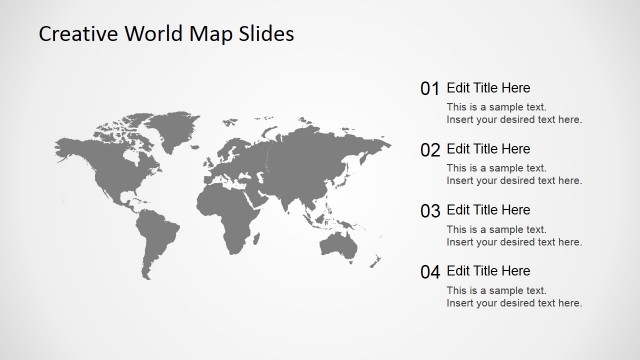
The layout features a central title at the top, stating 'Creative World Map Slides.' Below, there are various location pin icons arranged in a vertical column on the left, with larger icons at the top and smaller ones below. To the right, there are two human figures representing gender demographics, with a male figure on the left and a female figure on the right. Below these figures, percentage labels indicate 45% for men and 55% for women. The background is light, enhancing the visibility of the icons and figures.
How to Use It
This layout serves to present demographic data visually, specifically gender distribution, using icons and percentage labels. It fits well in a presentation sequence after discussing geographic data or market analysis. This structure is useful in business contexts such as market research, audience analysis, or demographic studies, where visual representation aids in understanding data trends and insights.
Text Placeholders & Capacity
Keep your copy within these limits so it fits without resizing. Title and node labels have moderate capacity, suitable for concise text.
| Placeholder | Count | Max characters (approx.) |
|---|---|---|
| Slide title | 1 | 30 |
| Item heading | 2 | 10 |
| Item body | 2 | 5 |
Slide Keywords
Download unlimited PowerPoint templates, charts and graphics for your presentations with our annual plan.
DOWNLOAD