Slide 8 of 8 from Free Business Plan Template for PowerPoint
Editable Business Plan Presentation
Financials Chart for Business Plans
- Chart
- Bar Horizontal
- Financial Summary Slide
- 16:9
- 100% Editable
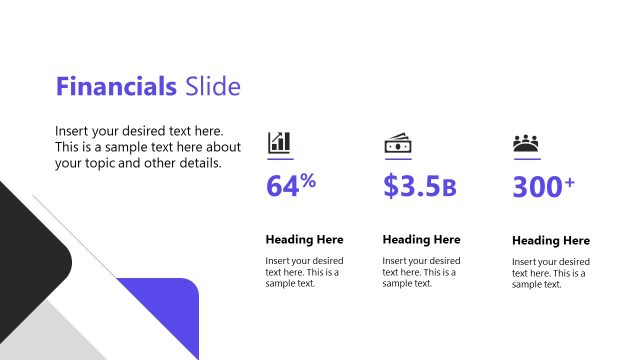
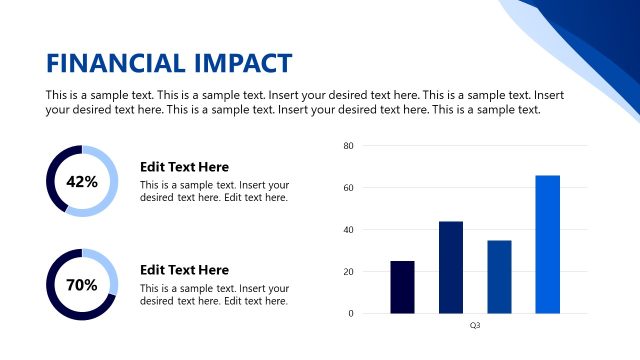
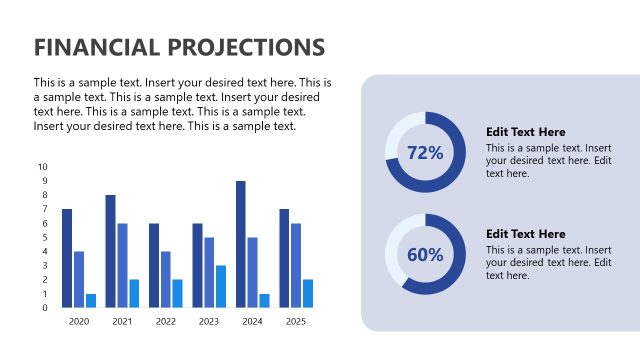
The Financials Chart with Icons slide from the Free Business Plan Template for PowerPoint offers a clear layout for presenting financial summaries using editable slides. Featuring a horizontal bar chart alongside vector icons, this slide template supports effective budget discussions and performance reviews within business presentations or pitch deck templates.
What’s on This Slide
The layout features a left-aligned icon of a blue money bag held by a hand, occupying the lower left corner. To the right, a vertical bar chart displays four horizontal bars in varying colors: purple, blue, teal, and another purple. Each bar has a corresponding text placeholder below it, indicating values. The title 'Financials' is prominently displayed at the top right. Text placeholders are present for additional information, positioned centrally on the left side, with a visual hierarchy emphasizing the chart on the right. The overall composition balances text and visual elements.
How to Use It
This layout serves as a financial overview, suitable for presenting key financial metrics or performance indicators. It fits within a business plan presentation, typically following sections on strategy or market analysis. This slide is effective for showcasing financial data comparisons, such as revenue projections or budget allocations. It can be used in meetings to discuss financial strategies or in reports to stakeholders to highlight financial performance.
Text Placeholders & Capacity
Keep your copy within these limits so it fits without resizing. Body slots can hold roughly 15-20 words each.
| Placeholder | Count | Max characters (approx.) |
|---|---|---|
| Chart title | 1 | 20 |
| Item heading | 4 | 30 |
| Item body | 4 | 10 |
| Body paragraph | 1 | 150 |
Slide Keywords
Download unlimited PowerPoint templates, charts and graphics for your presentations with our annual plan.
DOWNLOADReturn to Free Business Plan Template for PowerPoint.