Slide 5 of 7 from Free Artificial Intelligence Slide Template for PowerPoint
Free PowerPoint Slides Template for Artificial Intelligence
Data Trend Chart for Presentation
- Chart
- Line Chart
- Data Analysis Slide
- 16:9
- 100% Editable
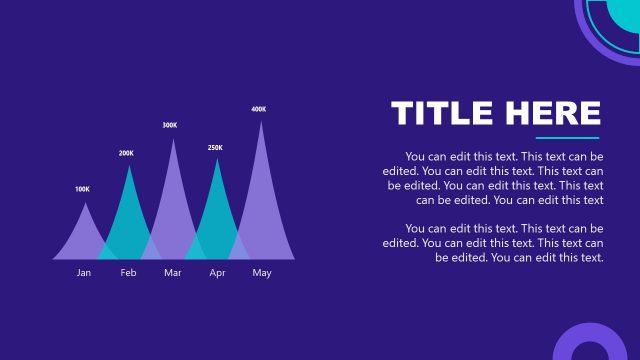
The Data Trend Chart slide from the Free Artificial Intelligence Slide Template for PowerPoint effectively visualizes sales trends and user engagement metrics. Featuring a clear line chart with labeled peaks, this editable slide allows for easy customization, making it a valuable tool for data analysis in corporate presentations.
What’s on This Slide
The slide features a data trend chart with five peaks representing values for the months January to May. The chart is positioned on the left side, with each peak labeled with corresponding values ranging from 100K to 400K. The background is a solid blue color, providing contrast to the chart. On the right side, there is a large text placeholder for the title, aligned at the top, and additional text placeholders below it for descriptive content. The overall layout is balanced, with a clear visual hierarchy emphasizing the chart.
How to Use It
This layout serves as a data trend chart, ideal for illustrating changes over time in a business context. It fits well in a presentation sequence after introducing a problem or opportunity, providing a visual representation of data trends. Scenarios include showcasing sales growth, website traffic, or user engagement metrics. The layout allows for easy customization of data points and text, making it versatile for various reporting needs.
Text Placeholders & Capacity
Keep your copy within these limits so it fits without resizing. Body slots can hold roughly 15-20 words each.
| Placeholder | Count | Max characters (approx.) |
|---|---|---|
| Slide title | 1 | 30 |
| Body paragraph | 5 | 100 |
Slide Keywords
Download unlimited PowerPoint templates, charts and graphics for your presentations with our annual plan.
DOWNLOADReturn to Free Artificial Intelligence Slide Template for PowerPoint.