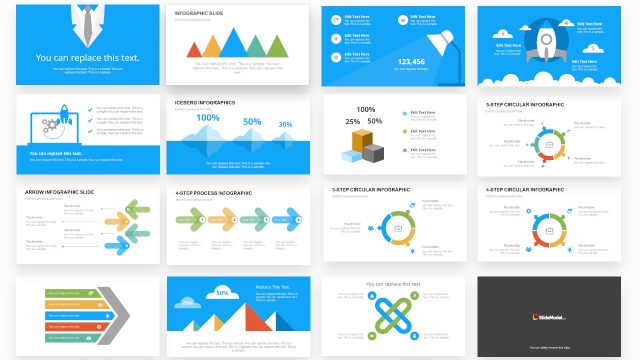
Slide 5 of 7 from #1 Infographics Slide Bundle for Presentations
PowerPoint Infographics for Presentations
Venn Diagram Slide for Presentations
- Diagram
- Venn
- Comparison Slide
- 16:9
- 100% Editable
What’s on This Slide
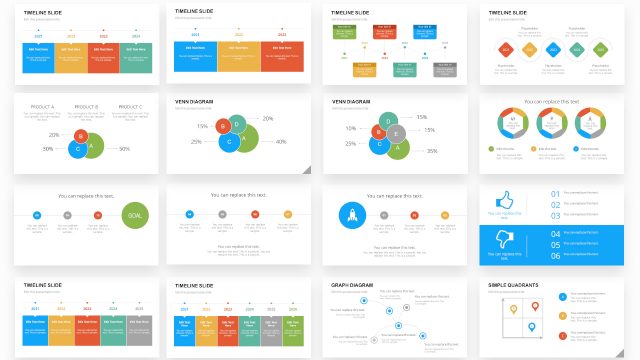
The slide features a Venn diagram positioned centrally, consisting of three overlapping circles. Each circle is labeled with letters A, B, C, and contains data labels indicating percentages. The circles are colored in blue, green, and red, with the overlaps showing combined percentages. Text placeholders are located at the top for a title and at the bottom for additional text. The visual hierarchy emphasizes the central overlaps, while the circles are evenly sized and spaced. The background is plain white, enhancing clarity.
How to Use It
This layout serves as a comparative analysis tool, suitable for illustrating relationships among three entities. It fits well in a presentation sequence after introducing a problem and before discussing solutions. This slide can be used in business contexts such as product comparisons, market analysis, or team dynamics, where understanding shared and distinct attributes is essential. It allows for clear visual communication of complex data relationships.
Text Placeholders & Capacity
Keep your copy within these limits so it fits without resizing. Node labels can accommodate brief text, around 5 characters each.
| Placeholder | Count | Max characters (approx.) |
|---|---|---|
| Slide title | 1 | 30 |
| Item heading | 3 | 10 |
| Item body | 3 | 5 |
Slide Keywords
Download unlimited PowerPoint templates, charts and graphics for your presentations with our annual plan.
DOWNLOAD