100% Editable Survey Templates for PowerPoint and Google Slides
Accurately implement data-driven decisions by showing customer research results with Survey Presentation Templates for PowerPoint & Google Slides. Survey PowerPoint templates are specifically designed to help professionals showcase their survey data in a clear, engaging, and visually appealing manner. These templates provide a structured way to present survey findings, ensuring that key insights are communicated effectively to stakeholders and team members. Download now!
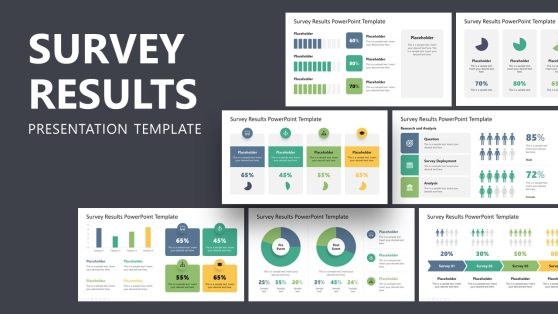
Survey Results PowerPoint Template

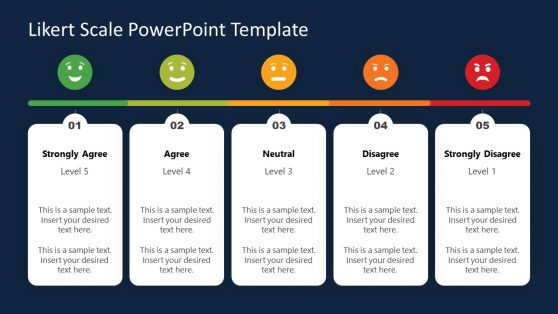
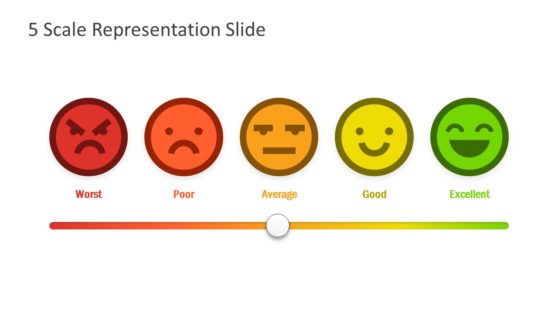
Likert Scale PowerPoint Template

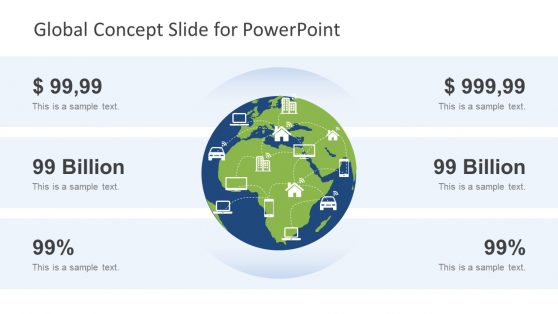
Global Concept Slide for PowerPoint
PowerPoint survey templates are crafted to streamline the process of converting survey data into professional presentations. With features tailored to display statistical information, these templates help illustrate complex data through charts, graphs, and tables, making it easier for audiences to understand the findings.
Advantages of Using Survey PPT Templates
The main advantage of using these survey results templates for PowerPoint is saving time, as they considerably reduce the effort required to showcase data in an easy-to-understand format. With sleek designs and a fully customizable layout, these templates project a professional image, helping presenters build their authority in the field.
The visual aids featured in these survey results PowerPoint templates allow the audience to connect with the discussed topic, making complex data easier to comprehend and retain for further reference. As a result, teams and stakeholders can align their vision toward the main business objectives, supporting informed decision-making.
What is a Survey Presentation Template?
A survey presentation template is a pre-made slide deck that displays a survey’s results. It includes slides for graphical data representation, text explanations, and summary insights, all formatted to convey the survey’s findings clearly and effectively.
How to do a Survey Presentation?
Start with an introduction that outlines the purpose of the survey and the methodology used. Present the key findings using graphical data representations like charts and graphs, and be ready to discuss how to implement your findings in relation to business or project goals. Conclude with a summary of the most important insights and propose the next steps or recommendations based on the data.
How do you Present a Survey in PPT?
To present a survey in PowerPoint:
- Use a dedicated survey presentation template to ensure your data is organized and visually appealing.
- Use various charts and graphs to represent your data visually. Where appropriate, use pie charts, bar graphs, and line charts.
- Highlight key statistics and findings prominently.
- Offer insights and interpretations alongside the raw data to add value and context.
- Ensure each slide is clear and not overloaded with information to maintain audience engagement throughout the presentation.