RAG Project Status Dashboard for PowerPoint
The Data-Driven RAG Project Status Dashboard for PowerPoint is a professional PowerPoint Template designed for Project Managers and Program Managers in charge of Software Projects. Each slide provides a PowerPoint Dashboard designed to professionally present KPIs (key performance indicators). Users can populate the chart’s values by editing the excel table associated with the data-driven chart. Shapes and tables are created with PowerPoint, allowing the user to customize it to the desired theme fully.
The RAG term is an acronym for Red, Amber, and Green. It is widely spread over project management practices and used for KPIs and Dashboards.
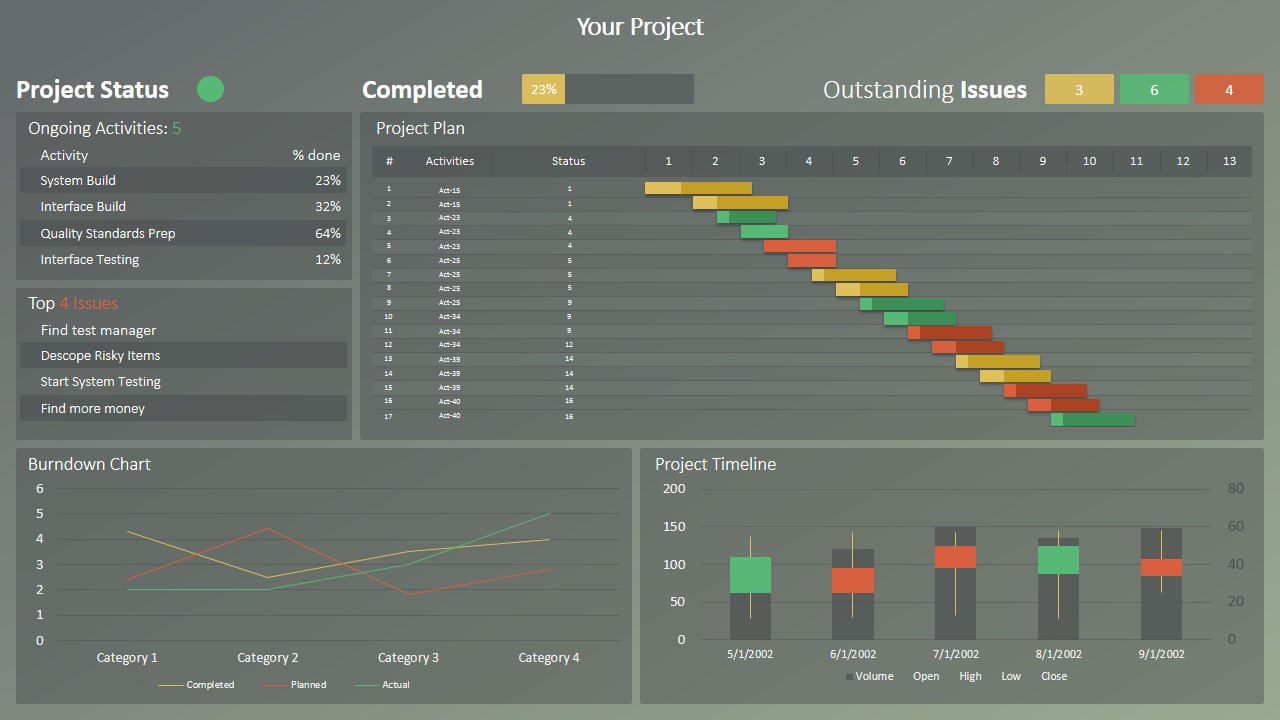
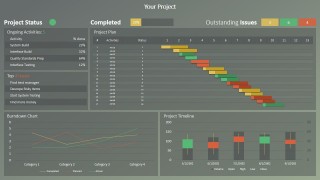
The first slide is an overall Project Description slide. It can be replicated for each of the projects of the Program. Under the Project Status Section, a circular indicator can provide a RAG indicator for project health. In the table below, the slide presents the Top 4 ongoing activities and the top 4 issues. A data-driven line chart is used to create a burndown chart. As the main component of the slide, the design presents a data-driven Gantt Chart. Made with a horizontal stacked bar chart, the user can populate tasks and progress directly from excel. The timeline slide is described as a candlestick chart, but the user can replace it with any of the PowerPoint Timelines of our gallery.
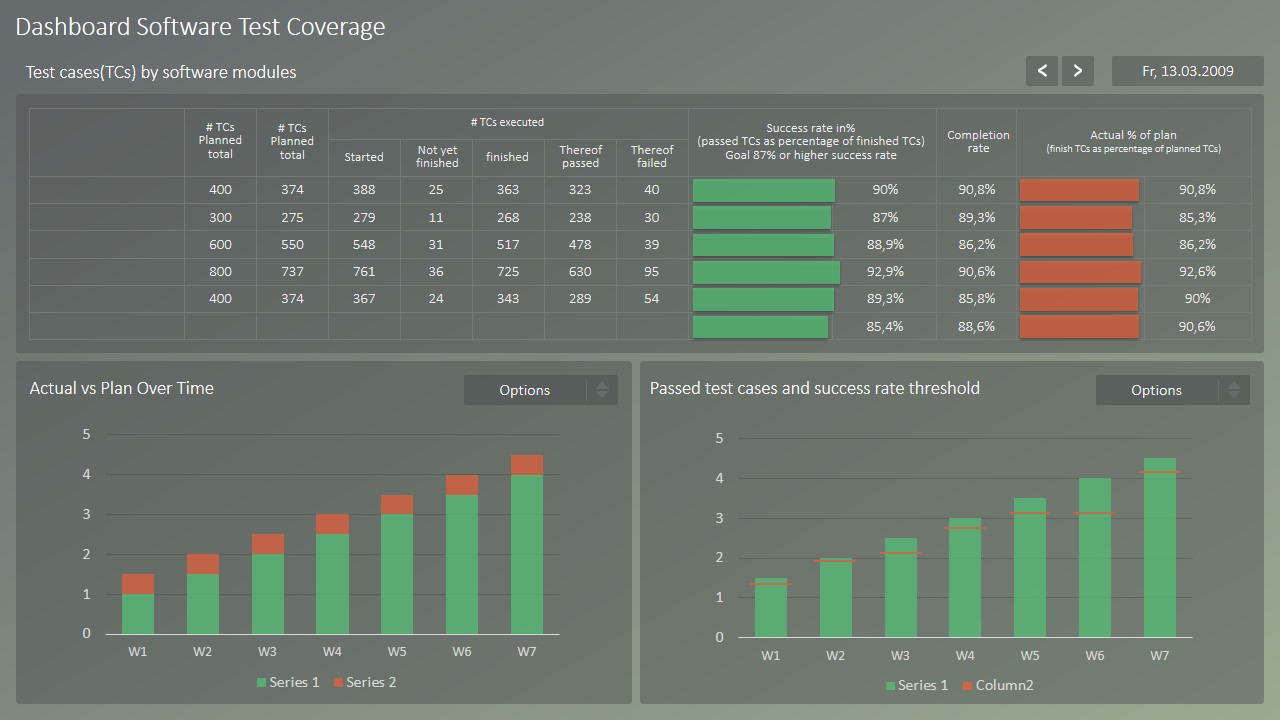
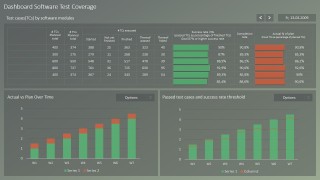
The second slide is a Test Cases description Dashboard. The user can record the number of test cases and their coverage. Actual vs. Planned Test case execution and Passed Success Rates are described in the dashboard’s bottom as column charts.
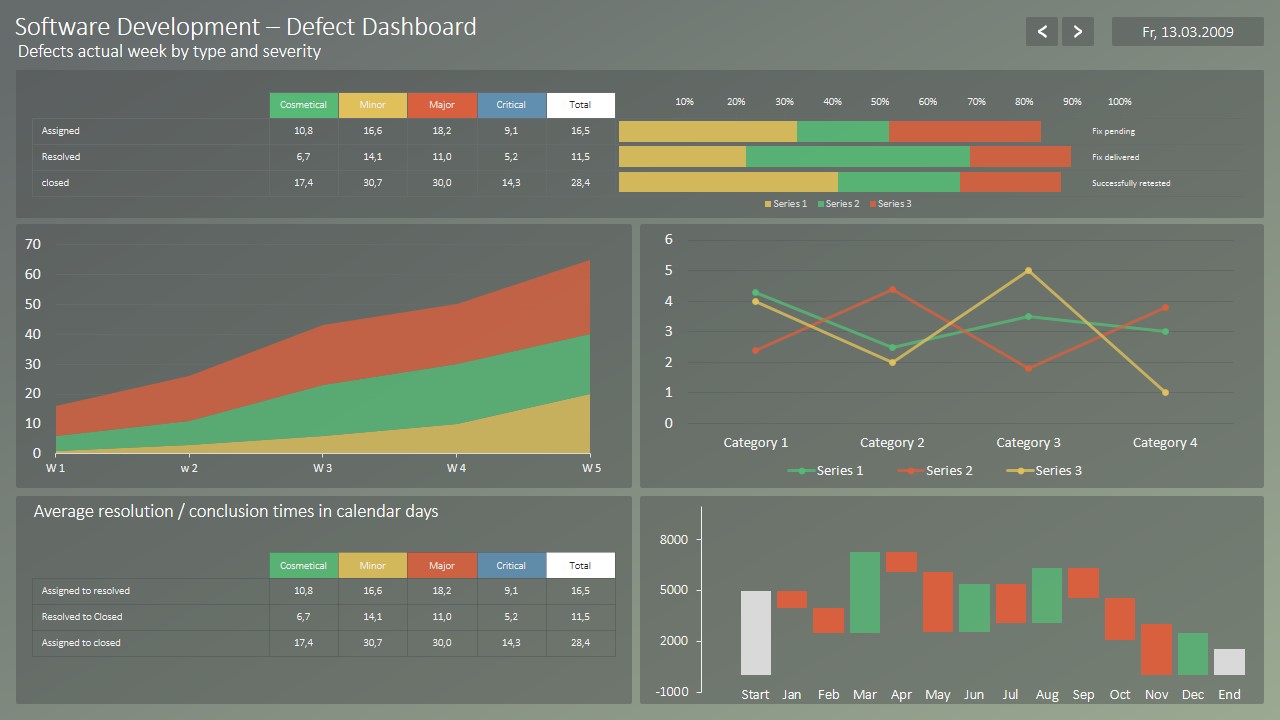
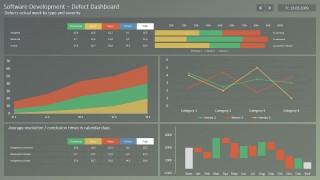
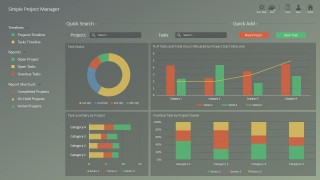
The third slide displays a Software Development Defects Dashboard. On Top of that, the critical metrics for defects are summarized by category. At the right, a percentage of progress is described by task. In the center, a cumulative stacked area chart described the progress over time of bugs, while a line chart described its resolution trends. Finally, two statistical charts are displayed at the bottom of the slide. On the left is a table with the average resolution times for bugs; on the right is a waterfall chart describing the inclusion/resolution statistics per month.
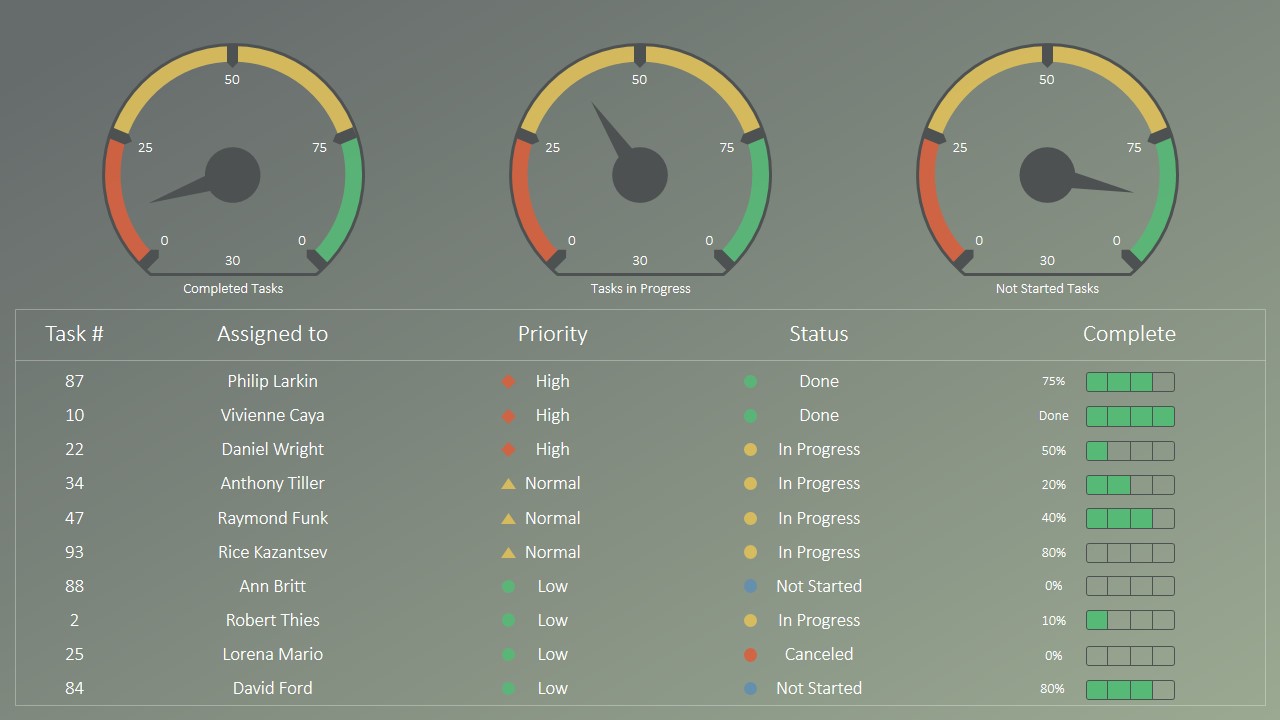
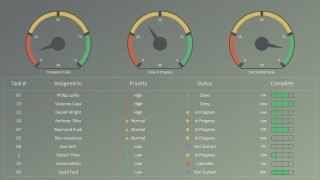
The fourth slide provides three gauges where the project manager can record the number of completed tasks, pending tasks, and not started tasks—a Table in the bottom records the top 10 tasks, their owners, and current progress.
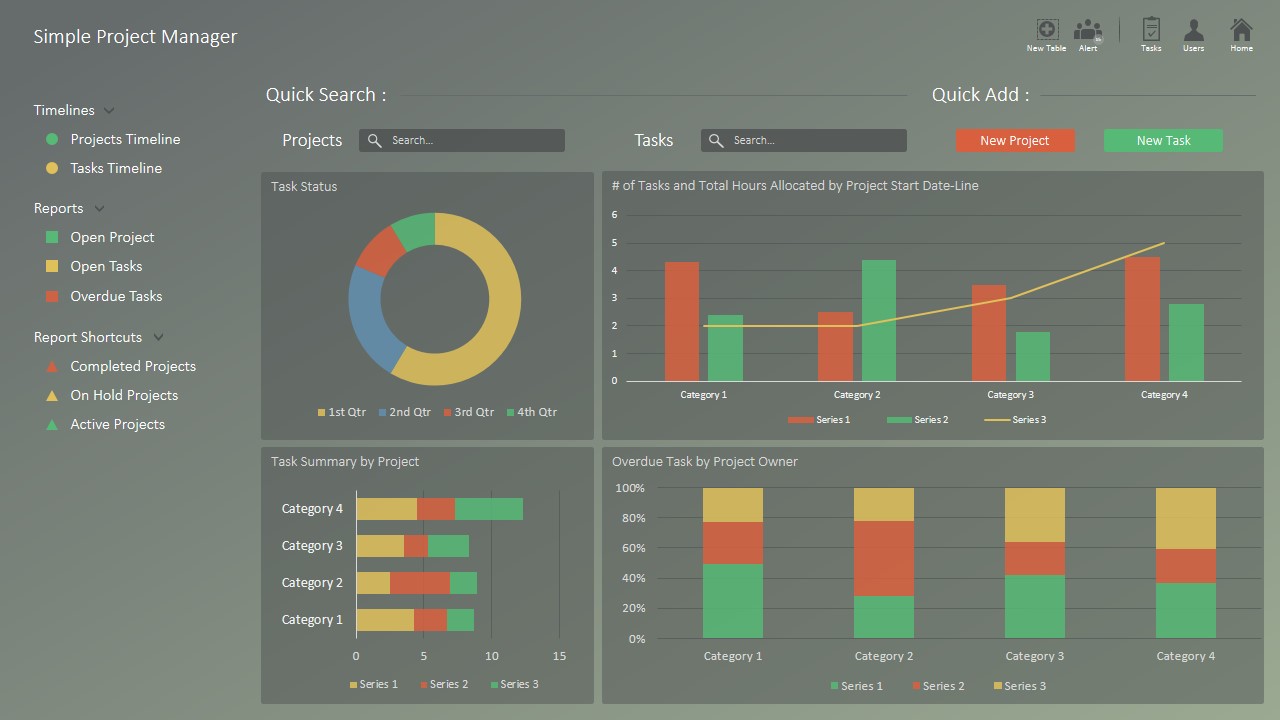
Finally, the last slide is intended for project managers to summarize different projects’ status over the program.
You must be logged in to download this file.
DOWNLOADDetails (5 slides)
- Category
- Data & Charts
- Rating


 Loading...
- Size
- 16x94x3
- Item ID
- 0032-01
- Colors
Supported Versions:
Subscribe today and get immediate
access to download our PowerPoint templates.