Flat Vintage PowerPoint Dashboard
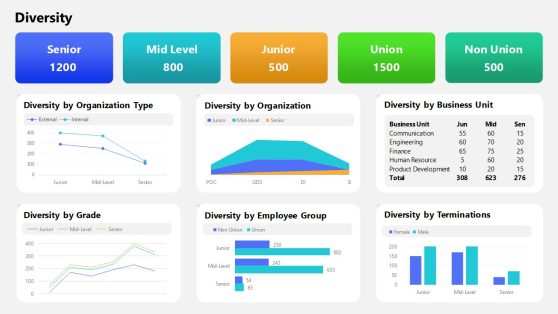
Flat Vintage PowerPoint Dashboard – Create professional business analytics presentations with a vintage look & feel. This PowerPoint Template provides Data Driven infographics elements ideal for creating dashboards and data reports.
Business dashboards are an information management tool used to track Key Performance Indicators (KPI’s) and key data points (metrics) relevant to a business or specific process. Using Infographic data visualizations, dashboards simplify complex data sets providing users with awareness of current performance at a glance. Due to the advancements of Big Data and data processing, organizations have adapted their decision making processes to be driven. Once the information is processed, it is summarized into kpi’s and metrics. Dashboards are the modern presenting layout for summarized information.
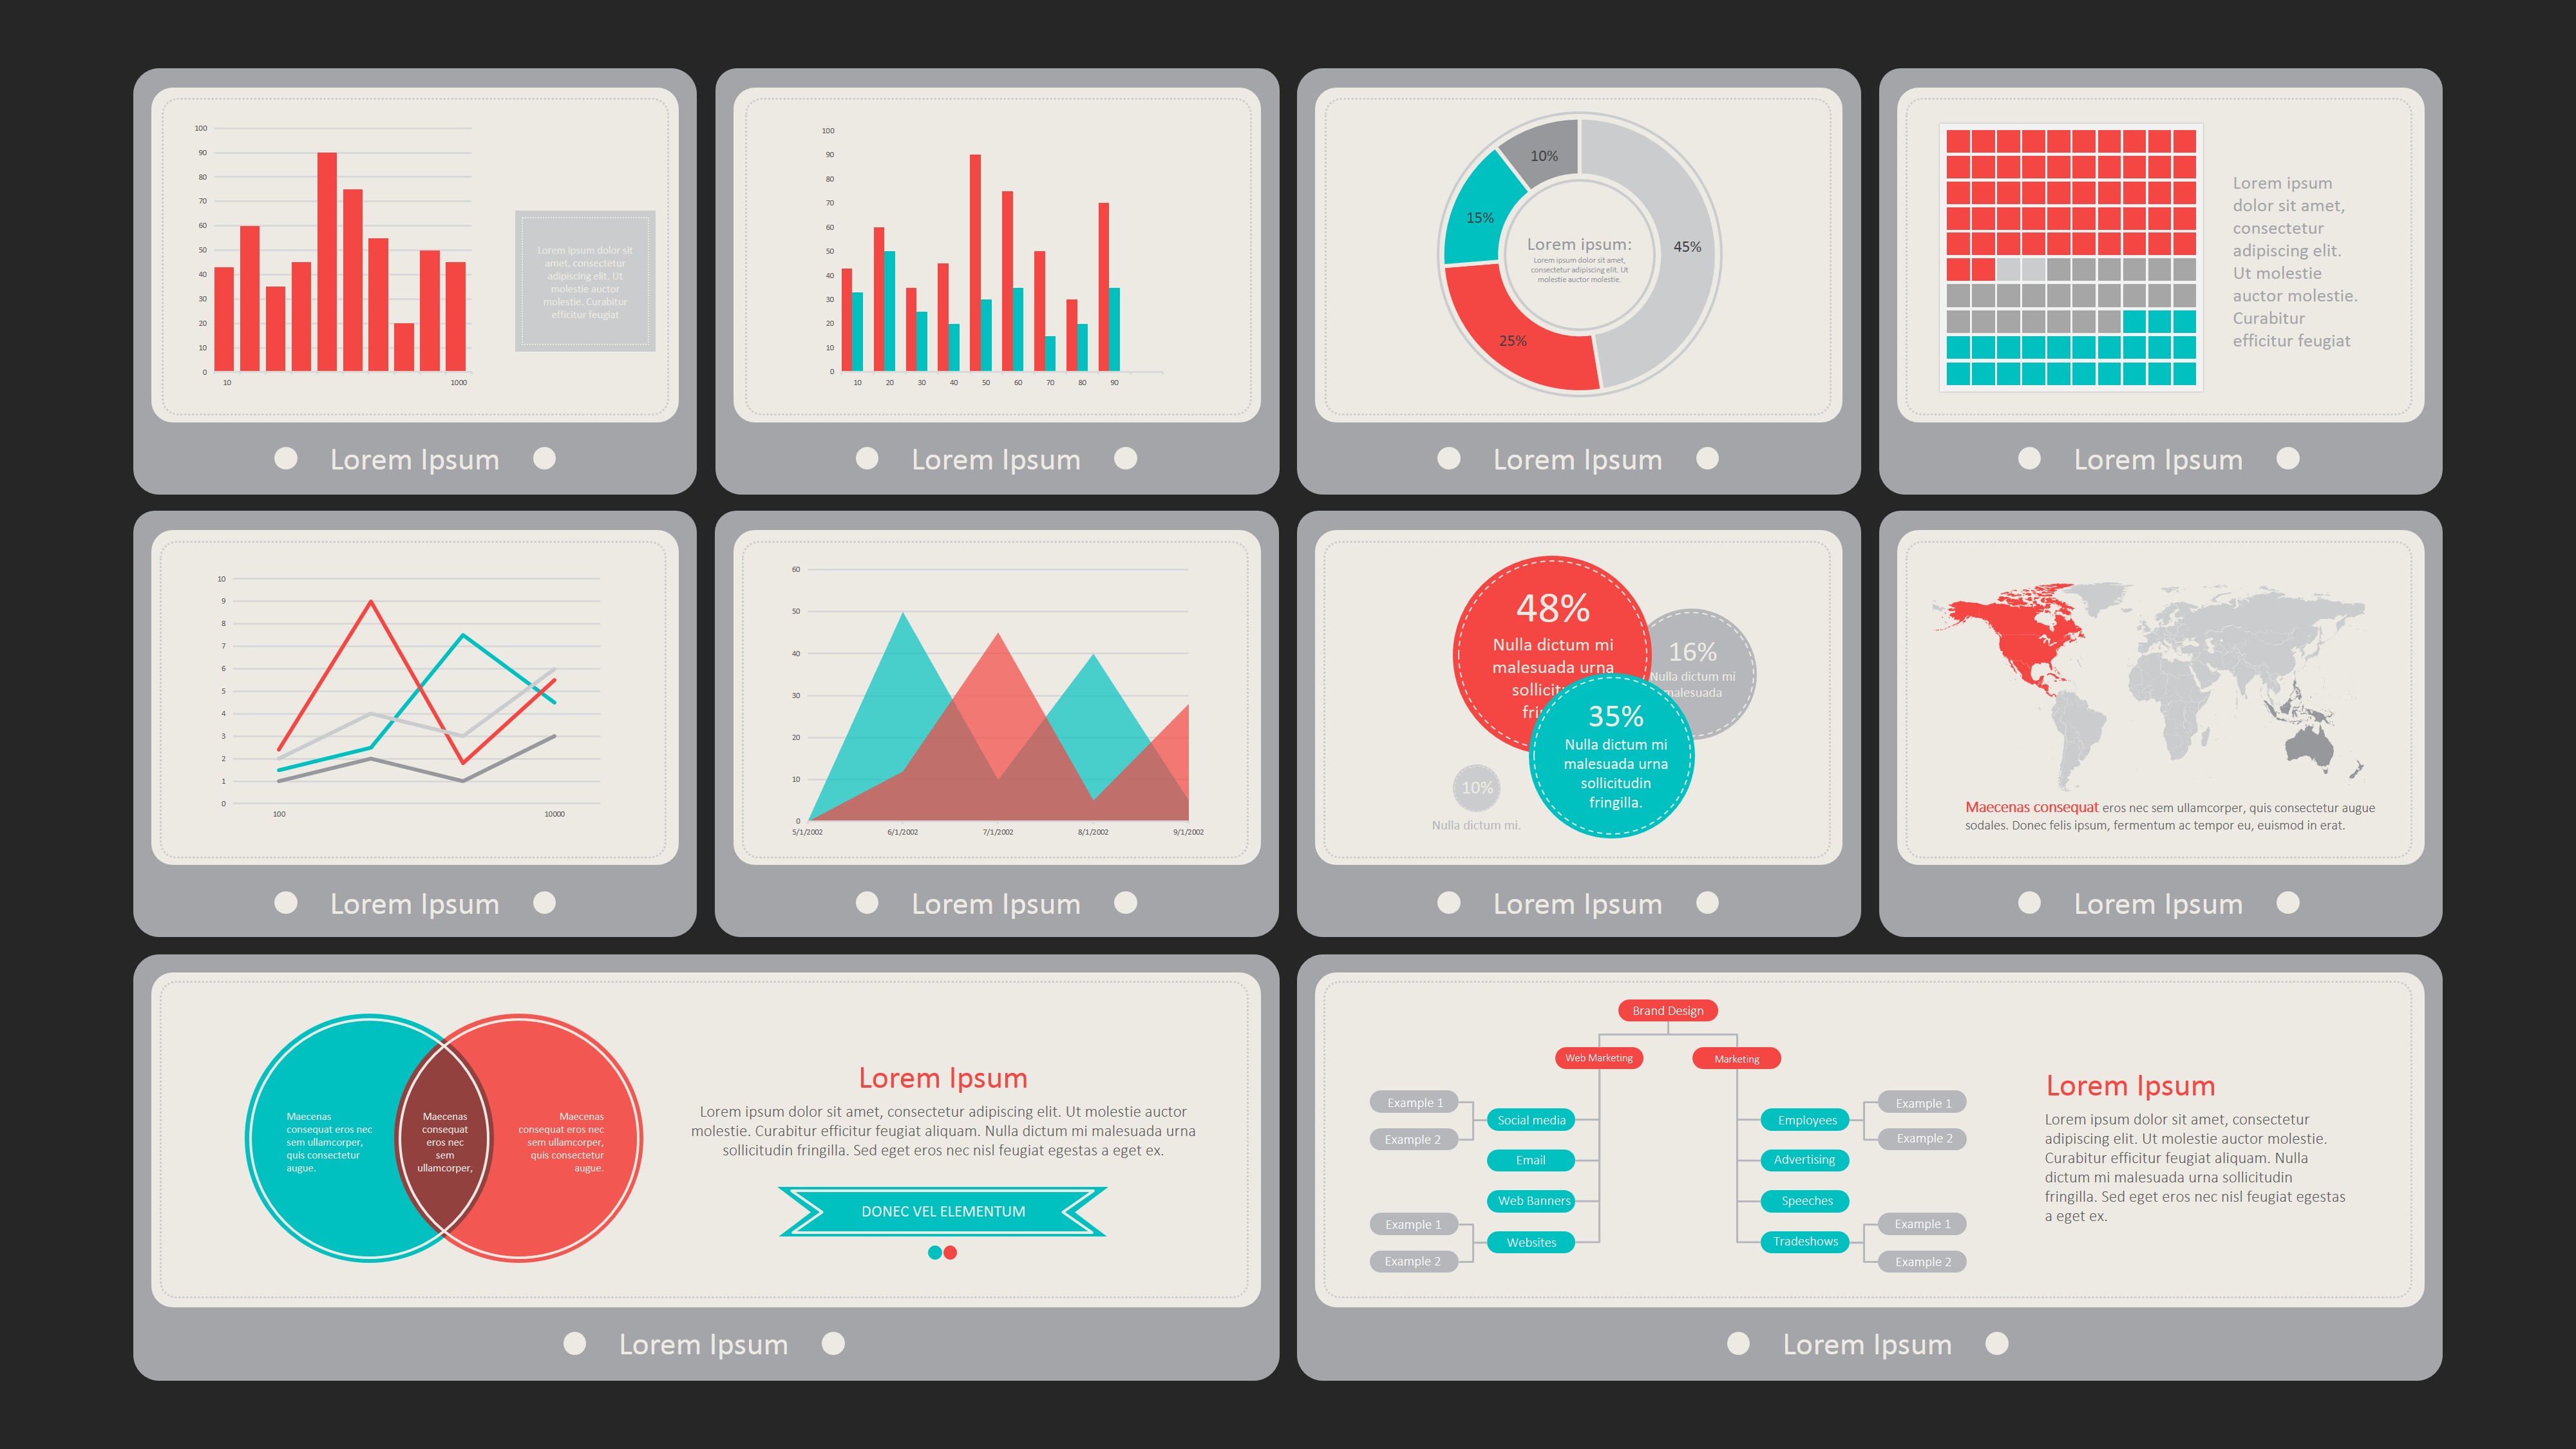
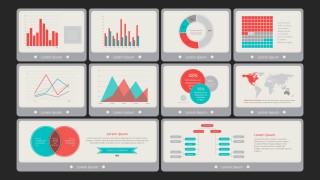
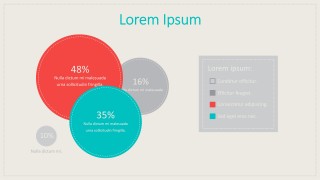
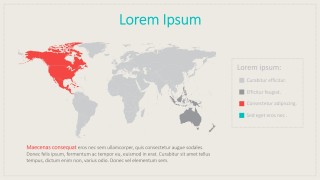
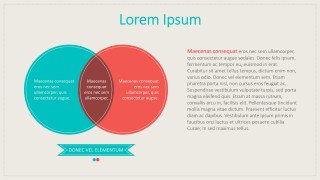
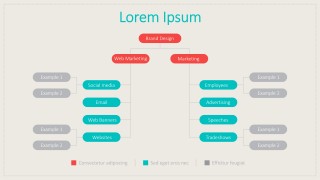
The Flat Vintage PowerPoint Dashboard provides a front slide with 10 widgets which contain different data representations. The PowerPoint Template provides the following data elements:
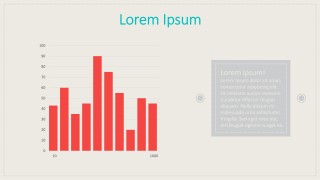
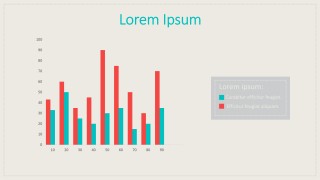
- Data Driven PowerPoint Column Charts (simple and comparison)
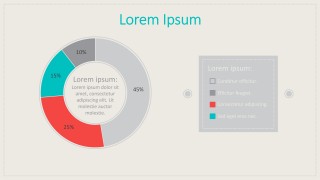
- Data Driven Donut Chart
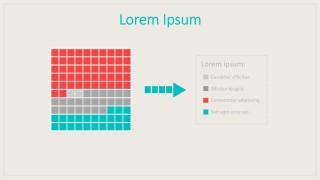
- Matrix Infographic Chart
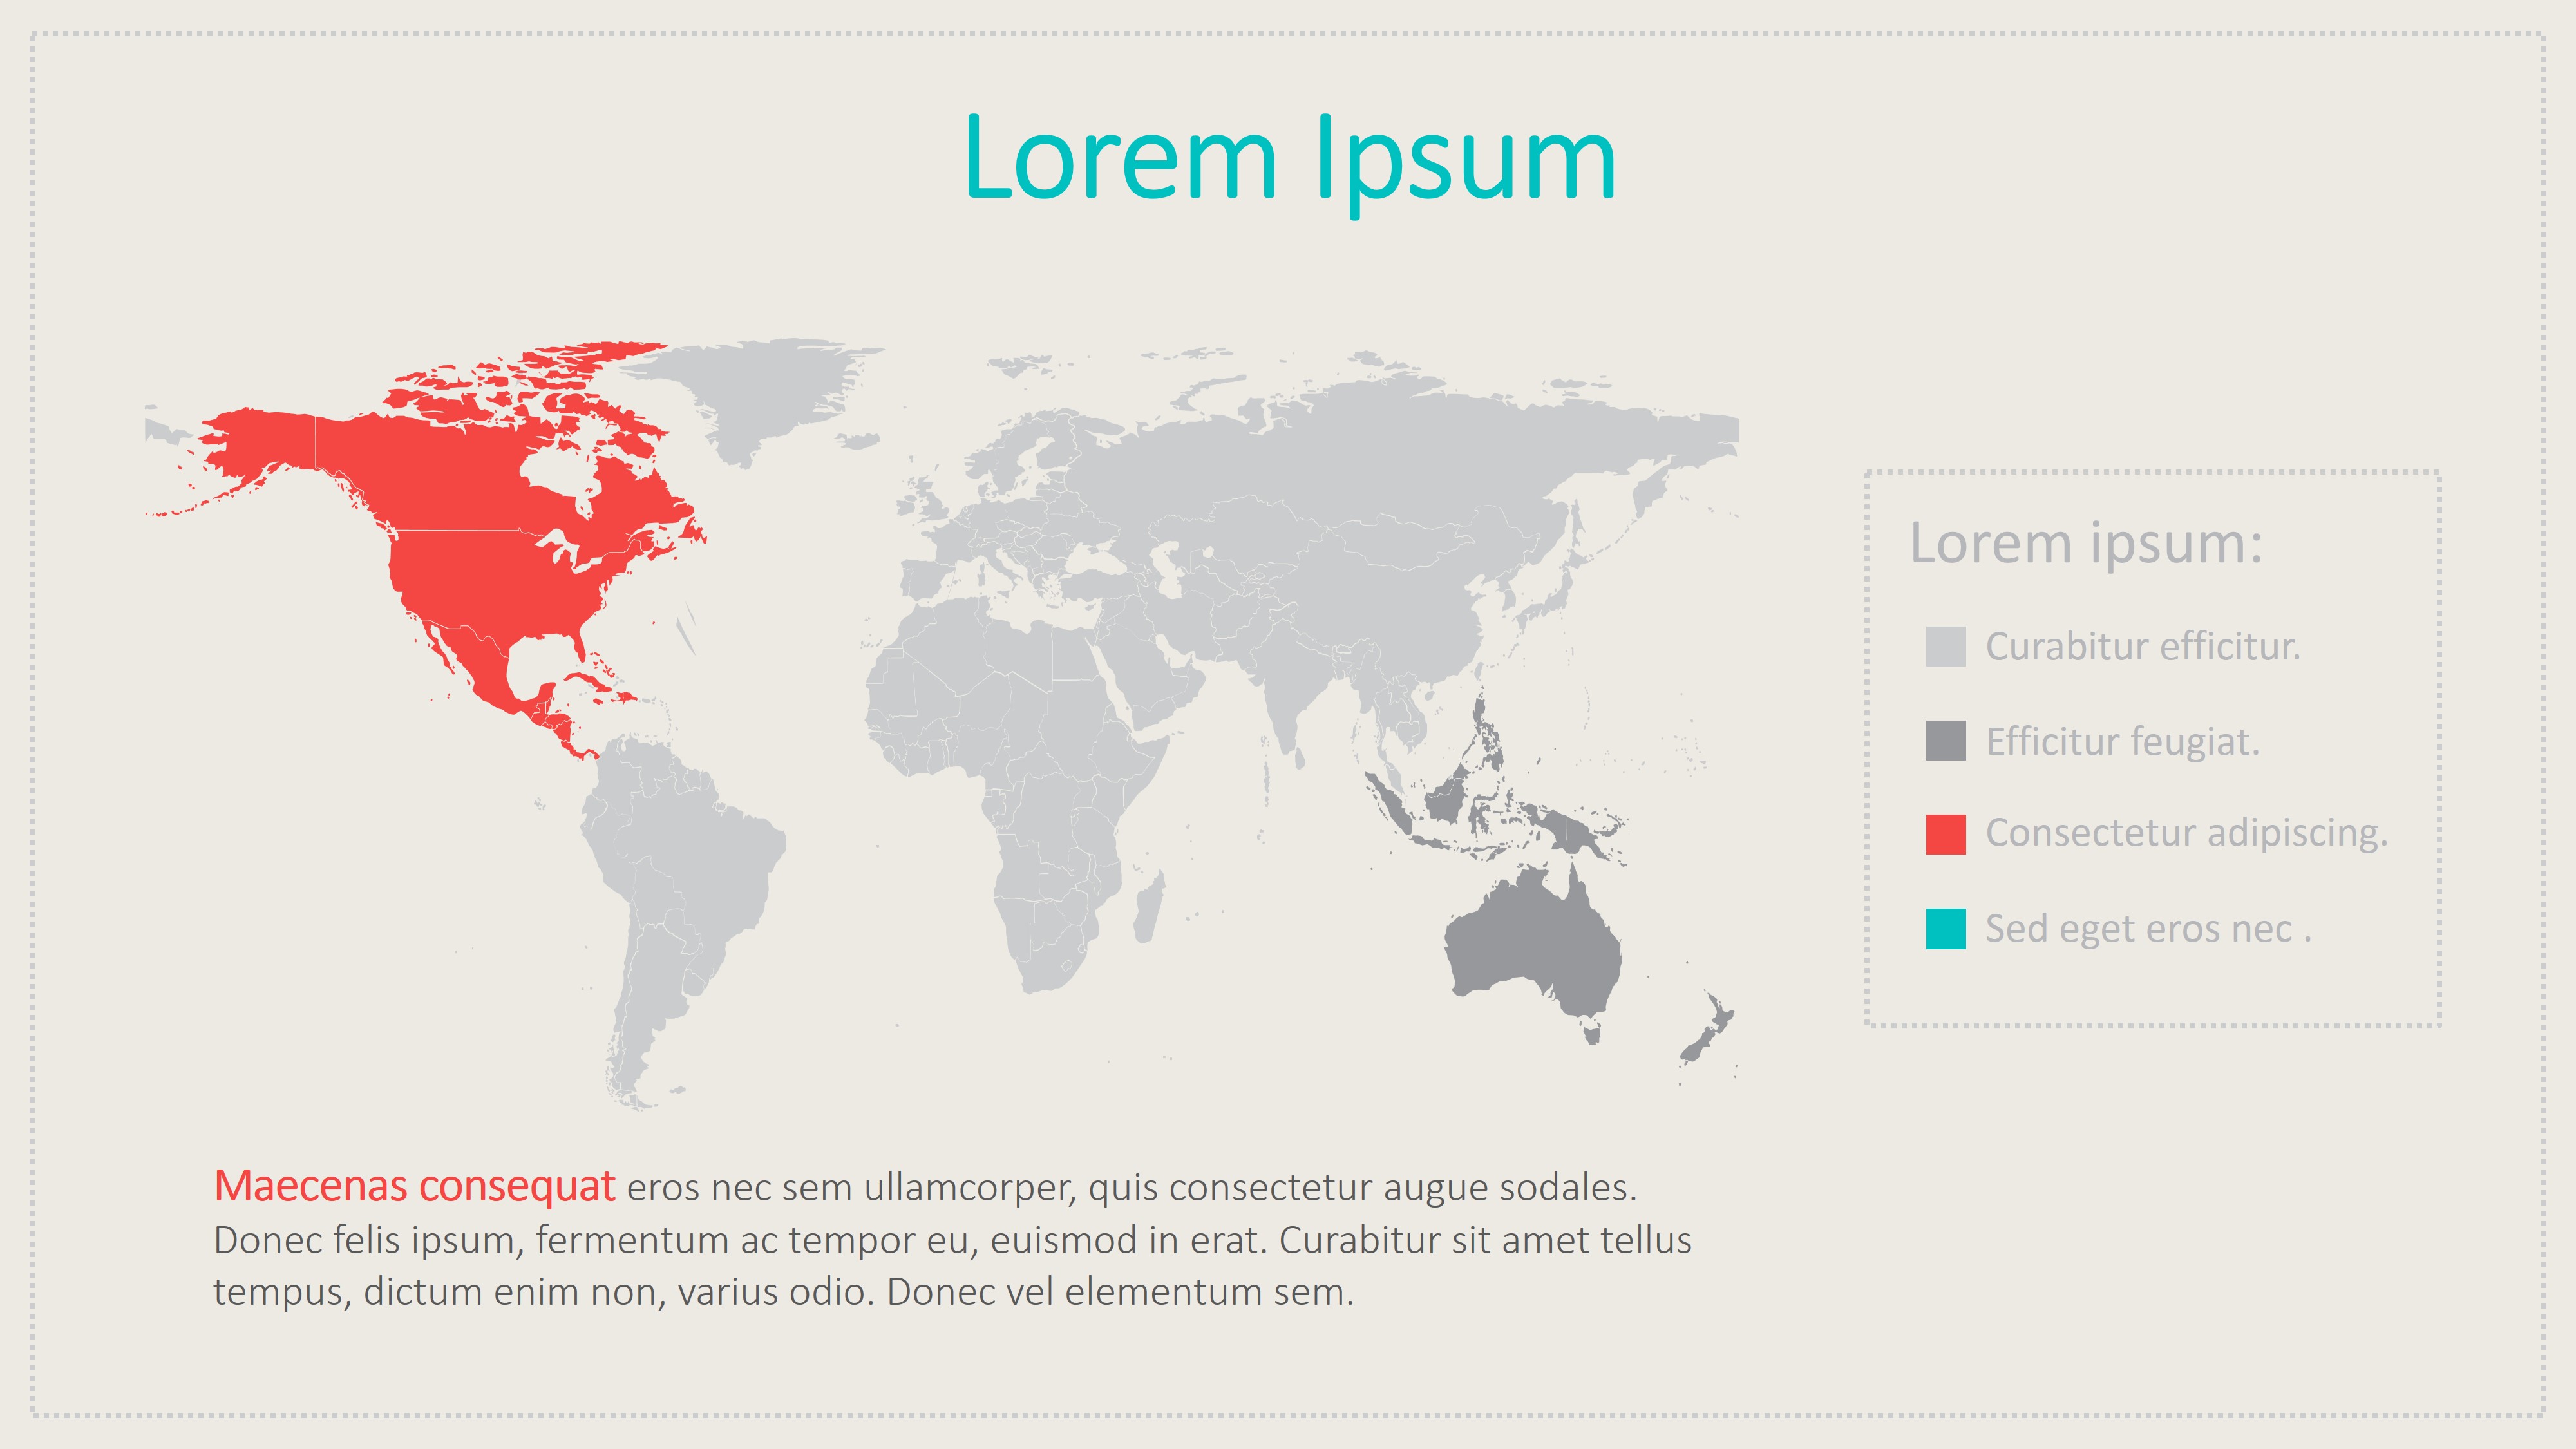
- World Map Chart
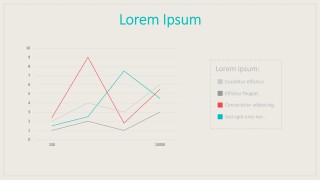
- Data Driven Line Chart
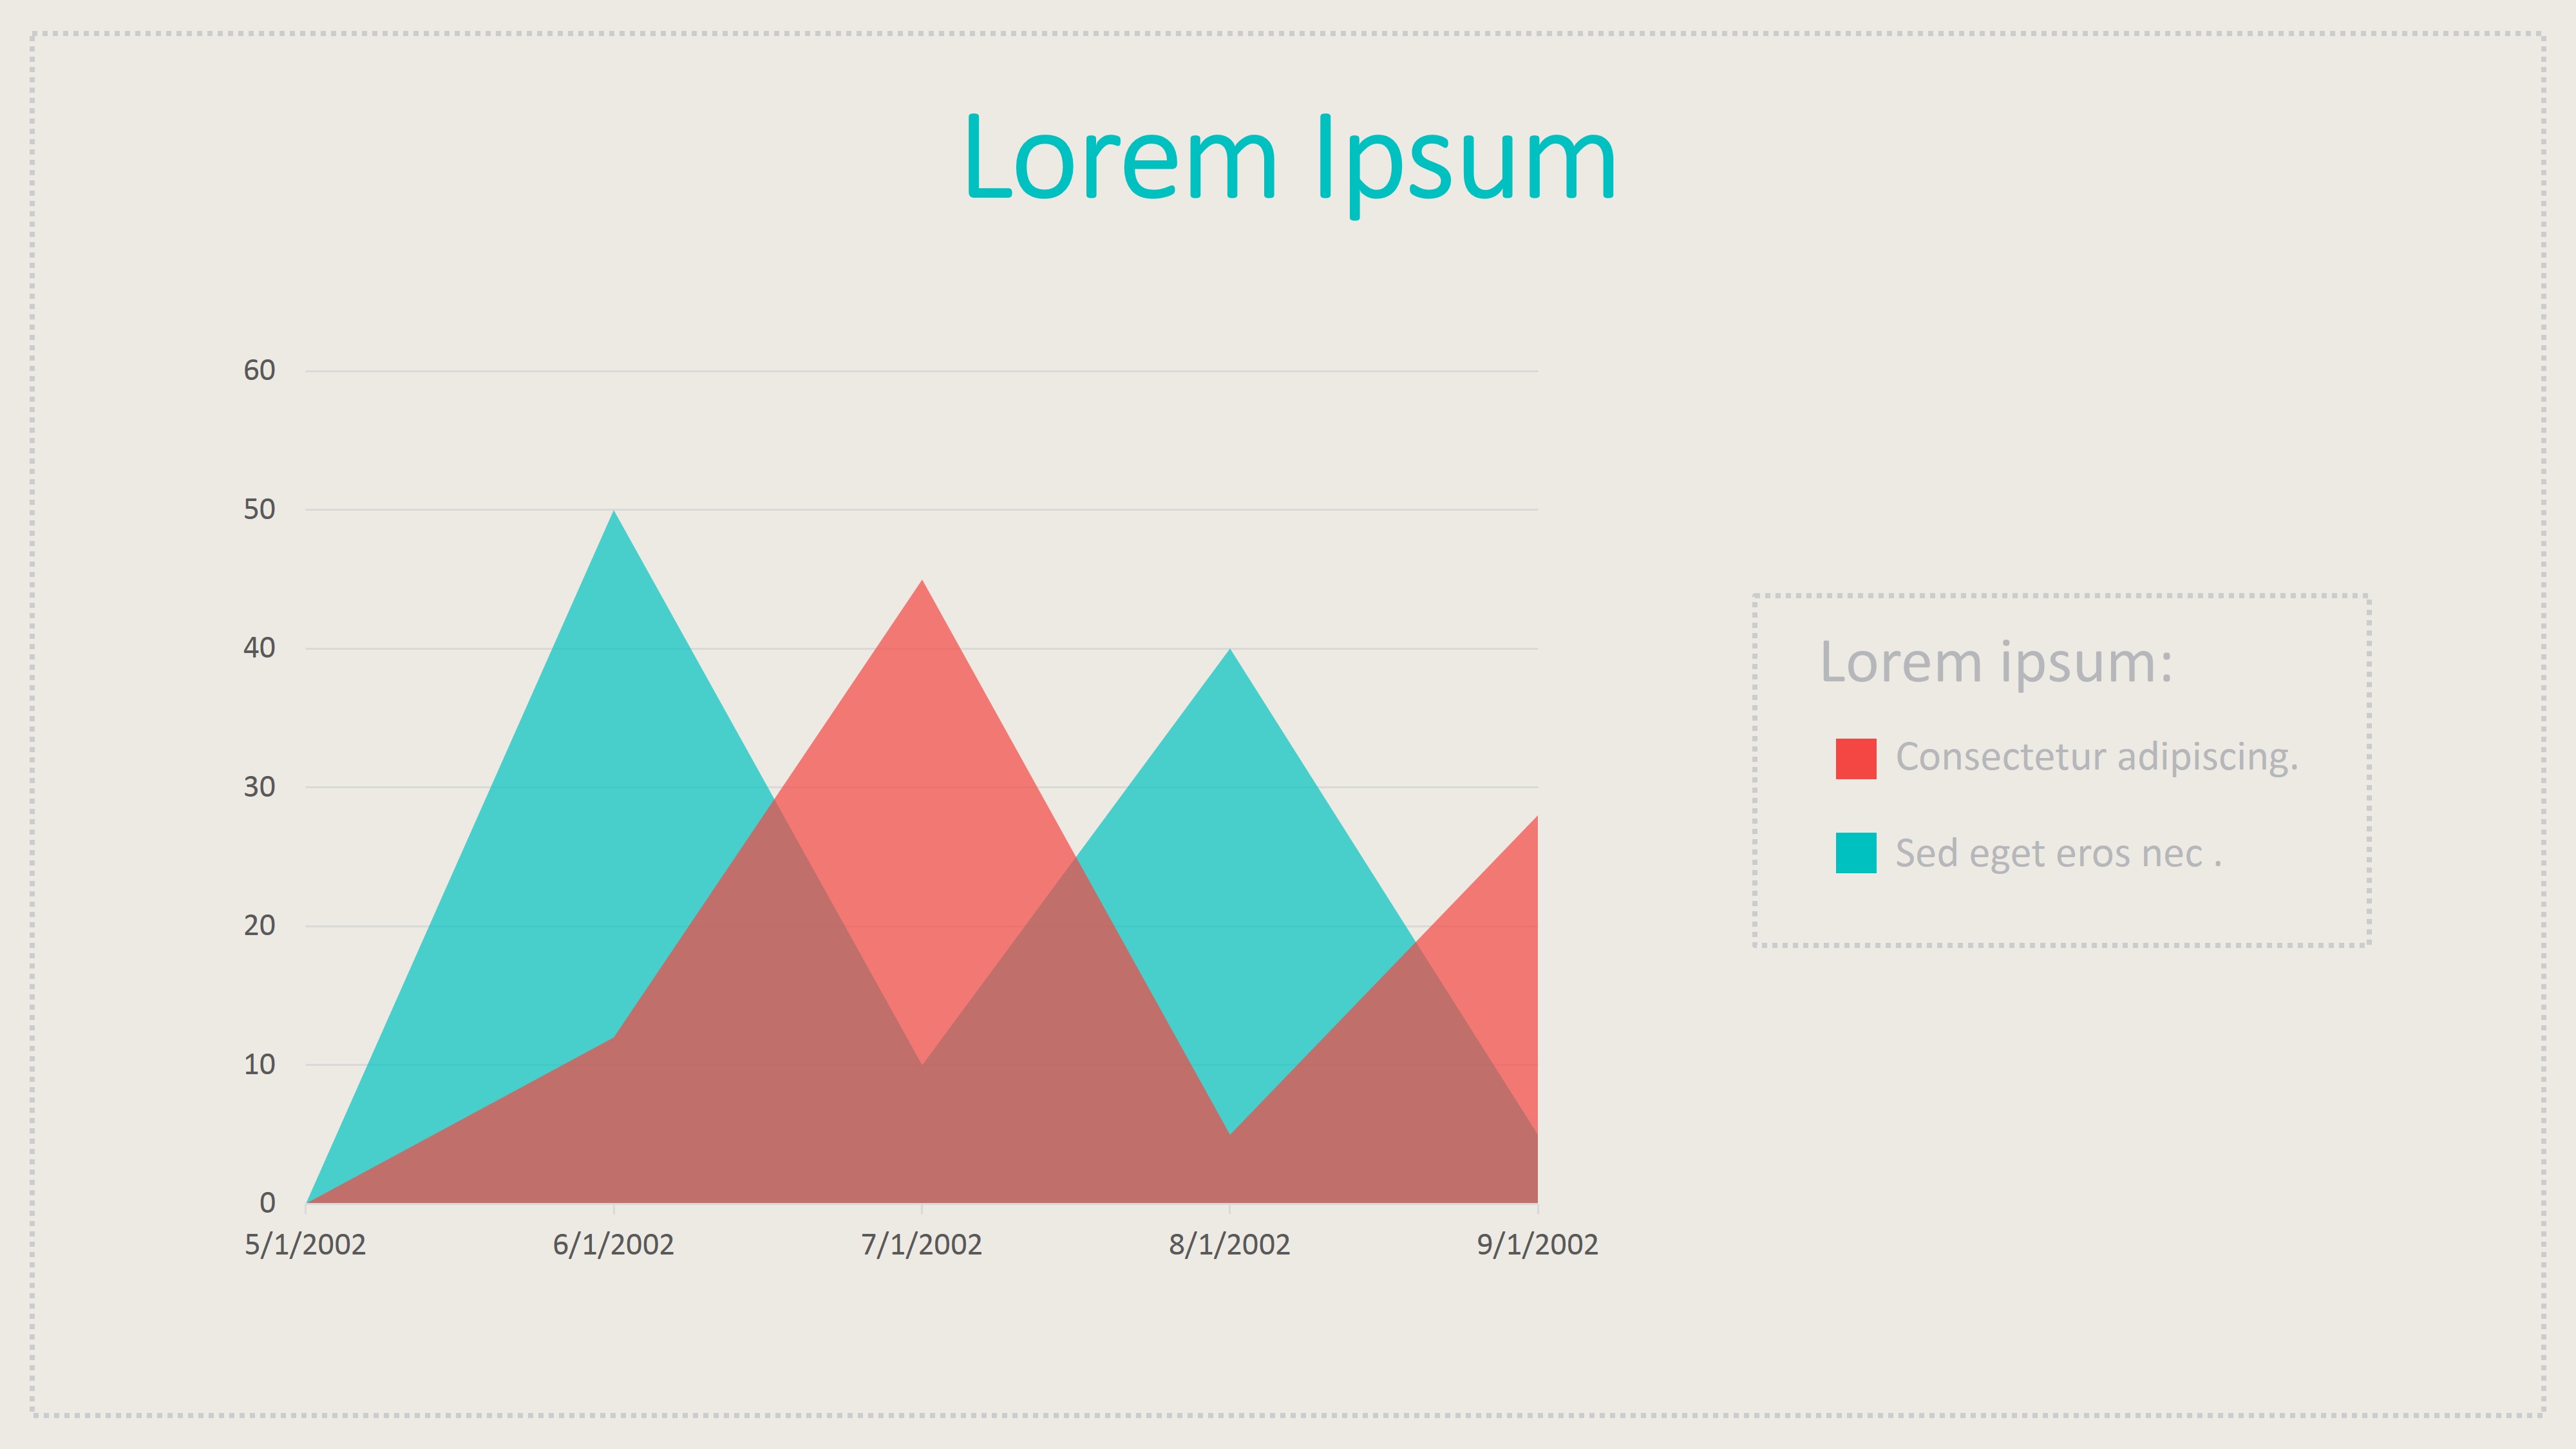
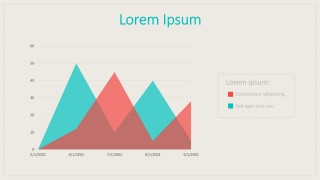
- Data Driven Stacked Chart
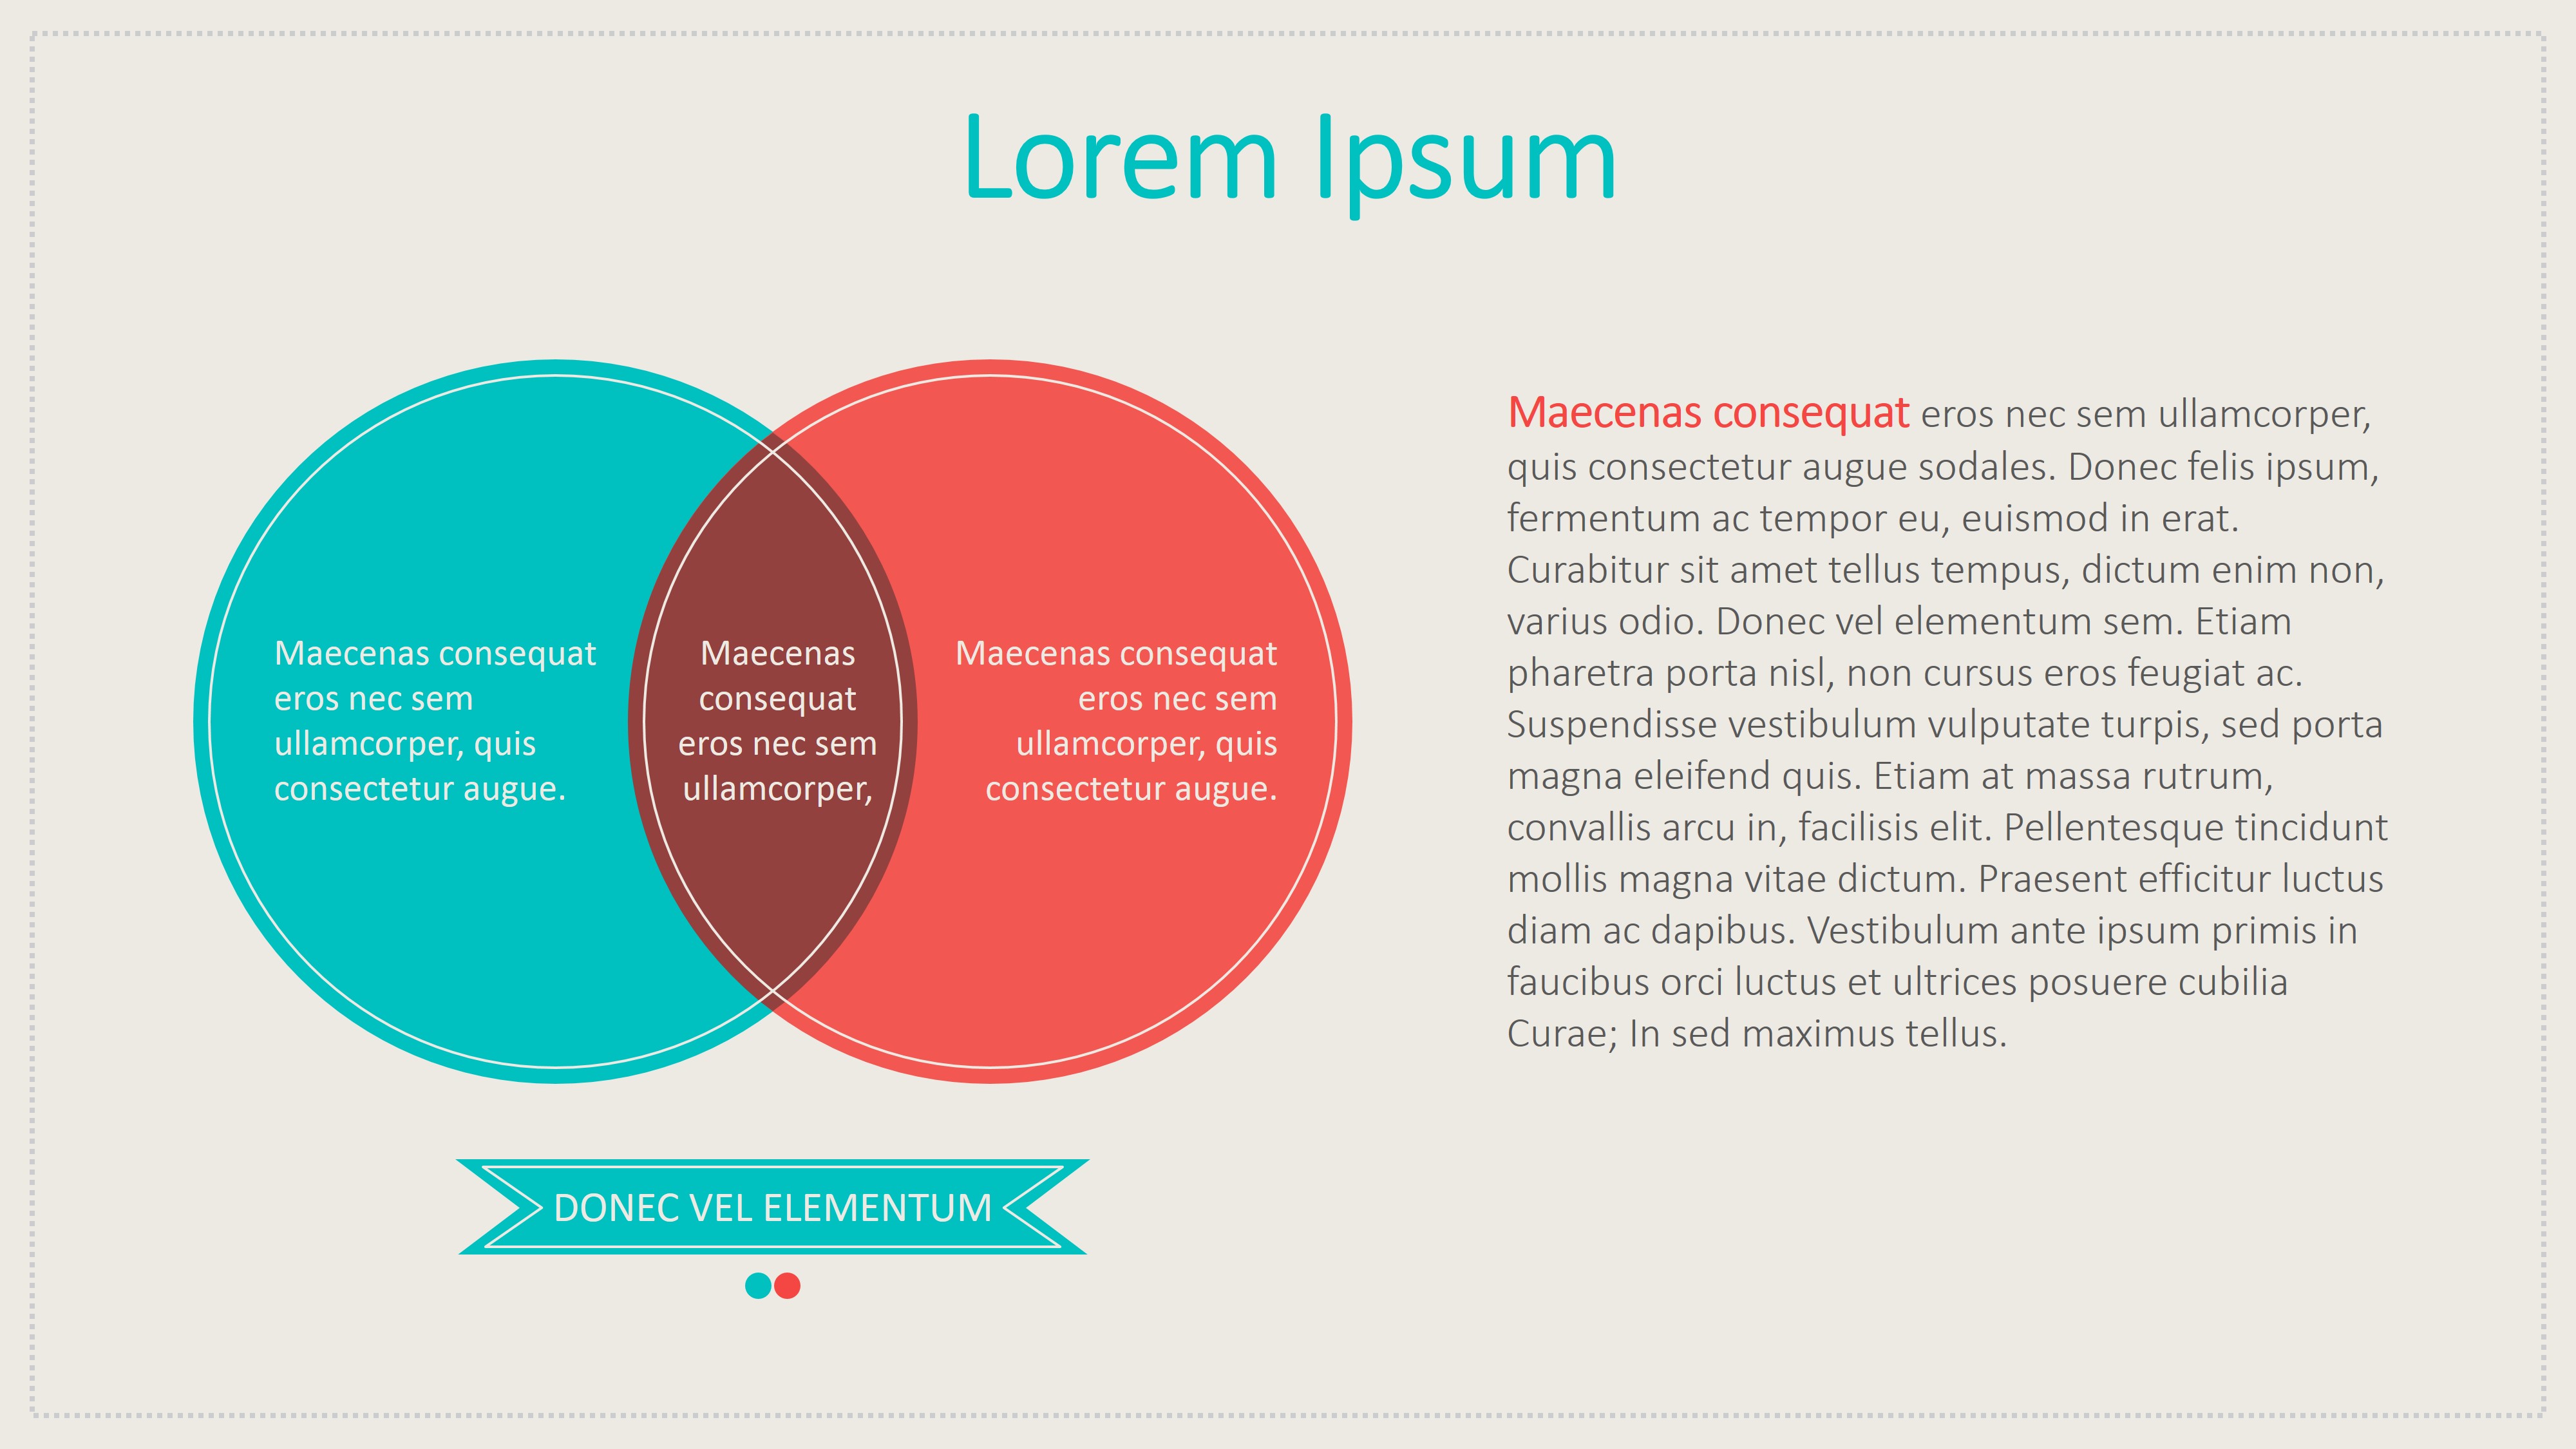
- Venn Diagrams
- Org Chart.
All the elements are themed with the Vintage look and feel. Every element is 100% customizable, the user can adapt colors and effect editing the element properties.
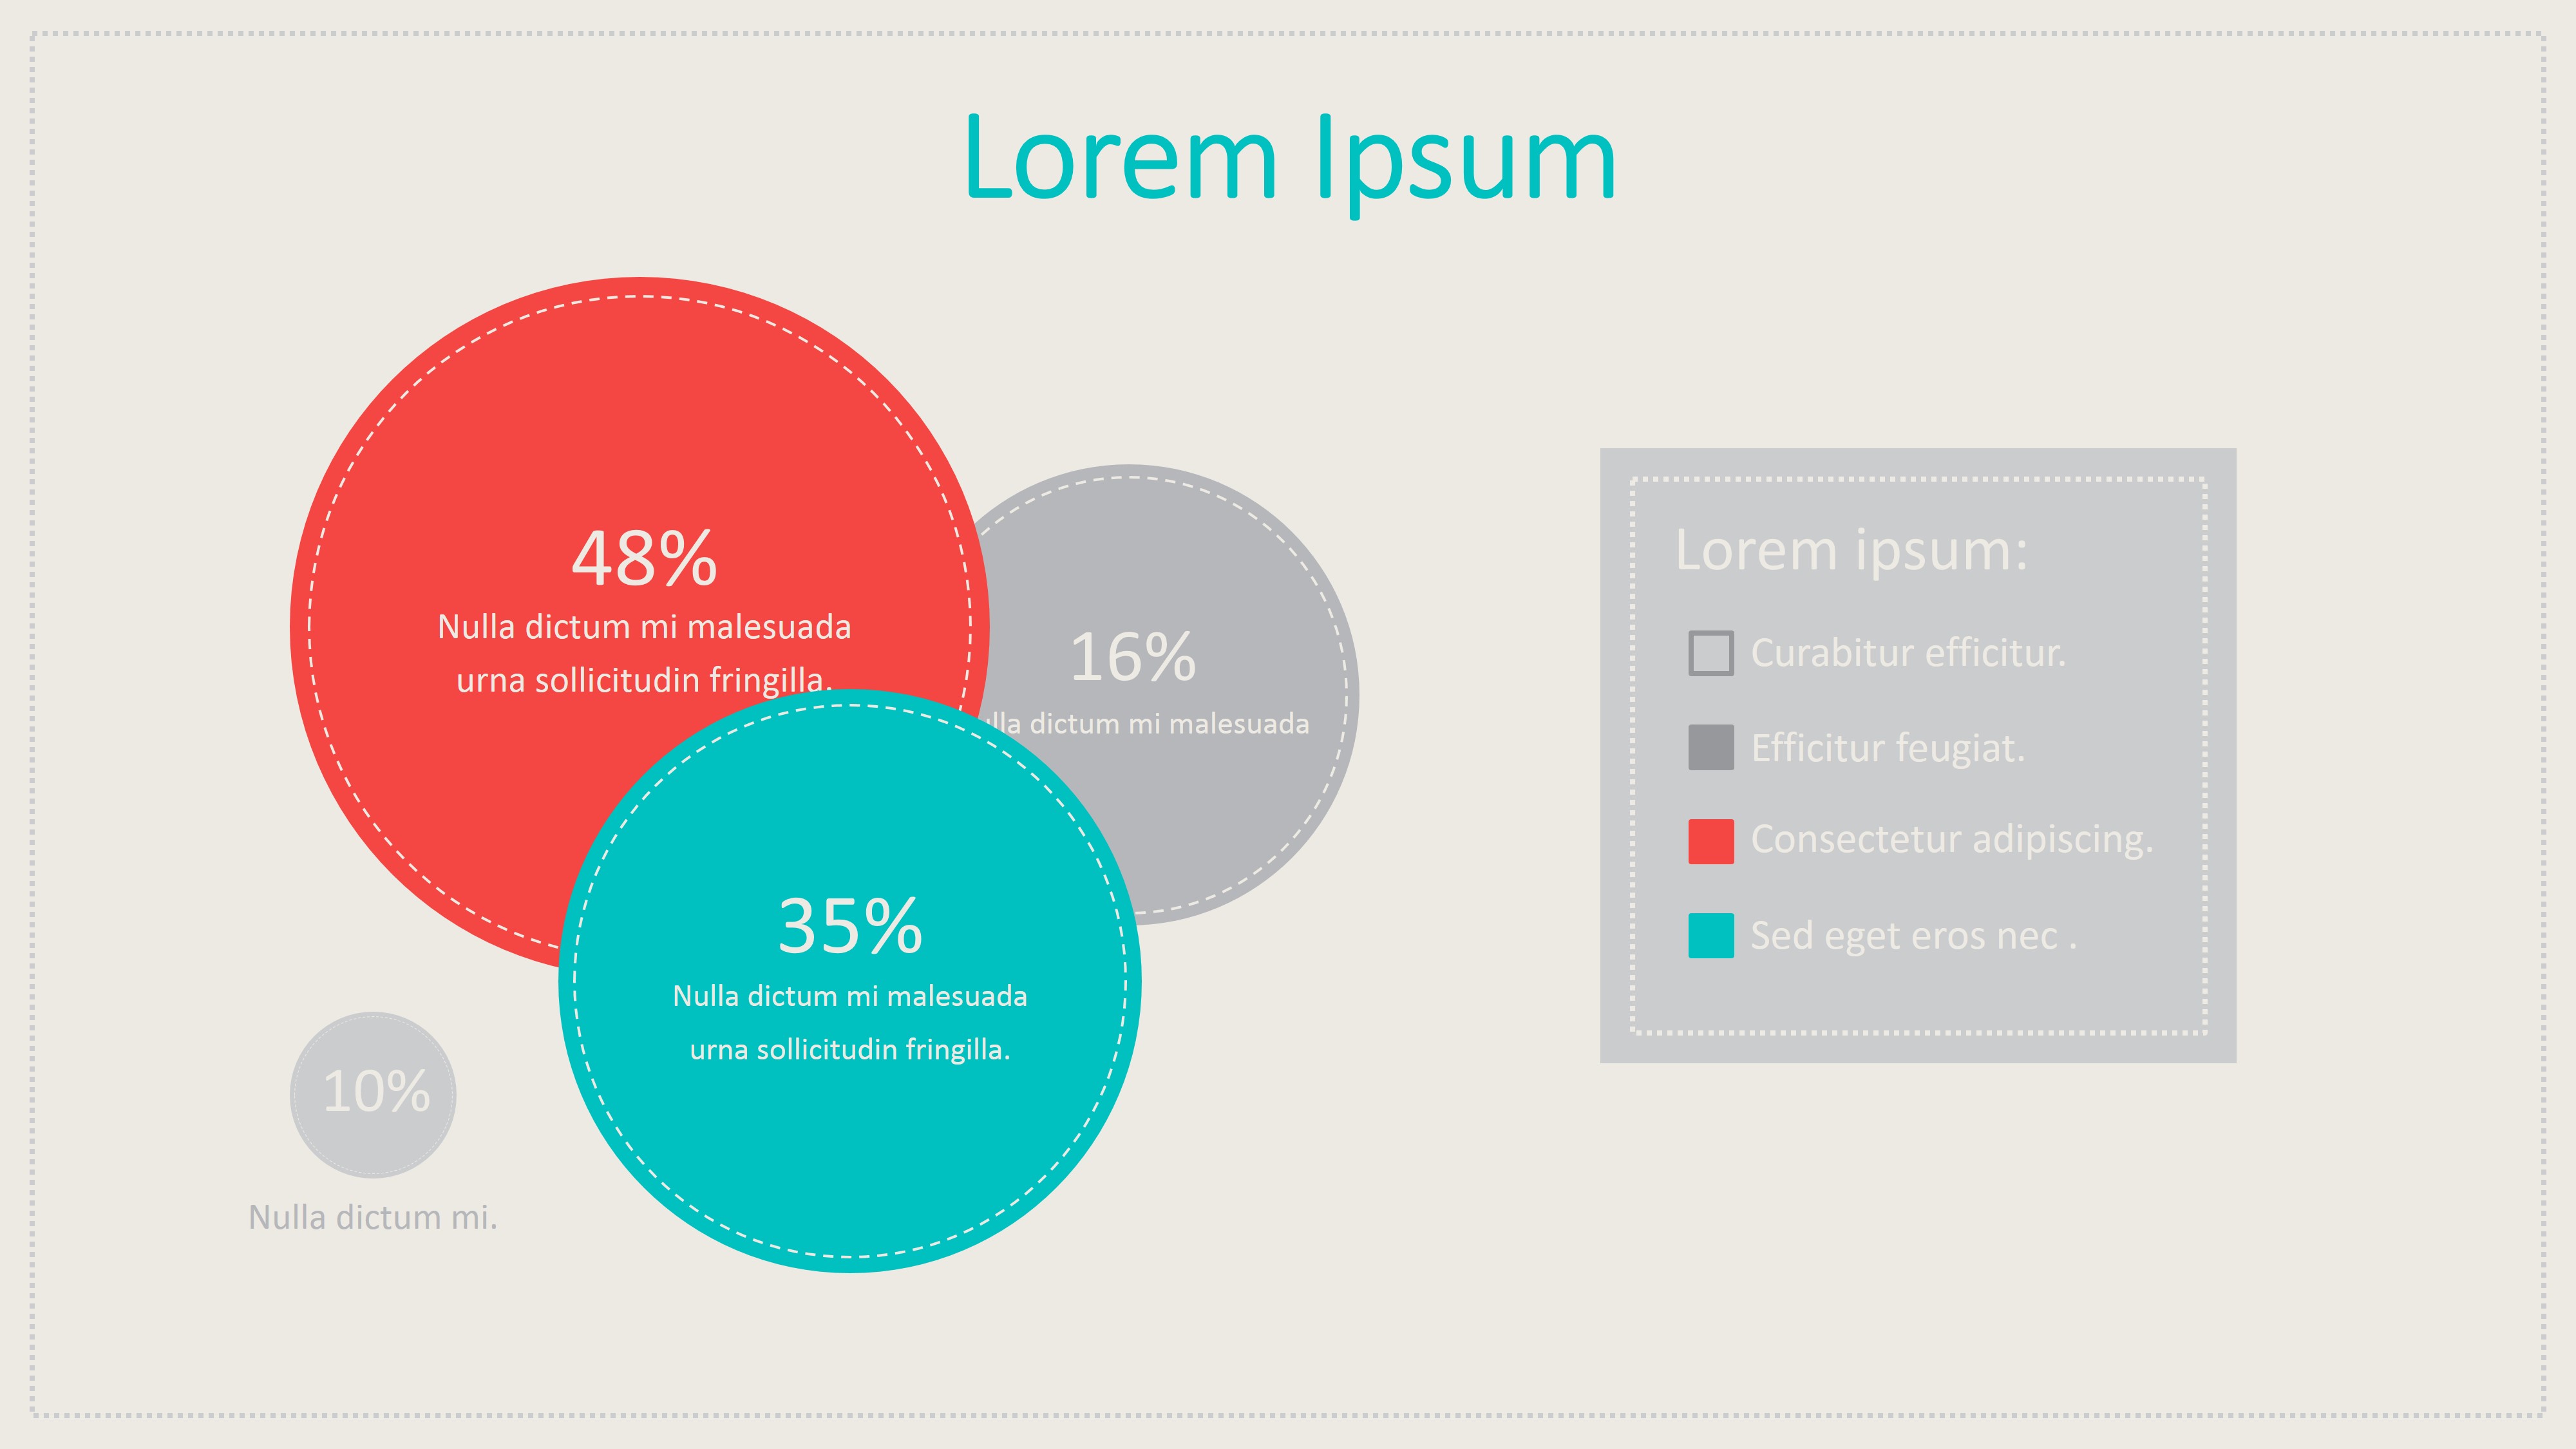
The following Slides are Indicators Reports. Each slide is a magnification of one of the widgets, with a text placeholder for drill down the information.This layout allows the user to drive the main presentation with the dashboard slide, and if necessary, navigate to the report slide for drilling down in the specific metric.
Impress your audiences with Professional Business Templates that appeal to executive audiences.
