Data Driven Waterfall Chart for PowerPoint

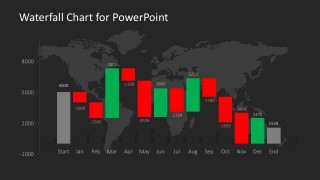
Data Driven Waterfall Chart for PowerPoint – Create professional PowerPoint presentations involving a waterfall chart with this data driven design. The chart is created with a traditional stacked column chart, allowing every user of PowerPoint to edit this chart through excel values. The tutorial How To Create a Waterfall Chart in PowerPoint and Excel explains how to create the chart and clarifies any doubt of the series editions.
The waterfall chart is a visualization traditionally used to explain the cumulative effect of positive and negative values introduced sequentially. It is also known as flying bricks chart and even as Mario chart. This names are a consequence of the metaphor of suspension columns (bricks in the air).
You must be logged in to download this file.
DOWNLOADDetails (1 slide)
- Category
- Data & Charts
- Rating


 Loading...
- Size
- 16x9
- Item ID
- 6195-02
- Colors
Supported Versions:
Subscribe today and get immediate
access to download our PowerPoint templates.