Blue Dashboard Template for PowerPoint
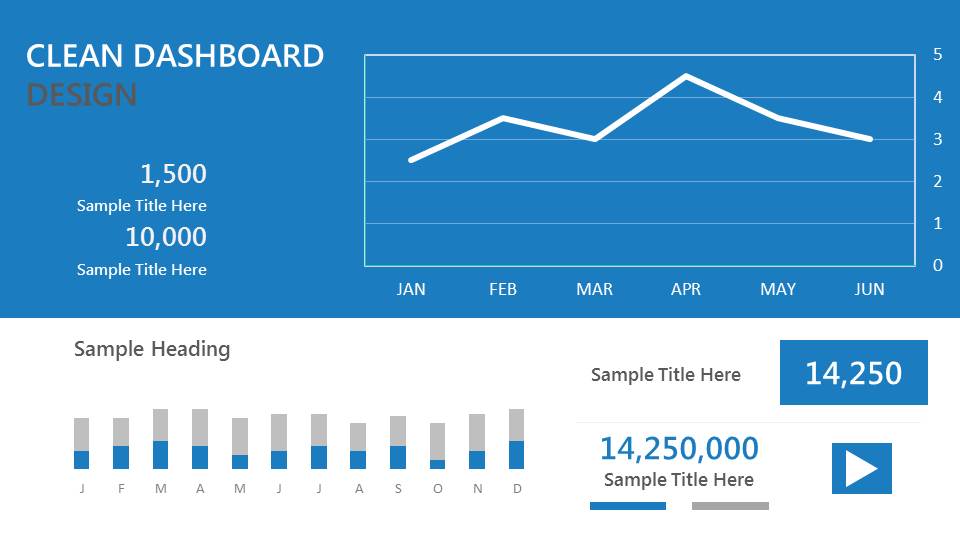
The Blue Dashboard for PowerPoint is a clean and professional dashboard that can be used to provide business performance data using visual elements such as data charts and dashboard gauges, as well as summarize a larger presentation into smaller, data-driven bits of information.
Dashboard templates are a great tool in any professional’s repertoire as they can be added to any PowerPoint presentation to provide an overview or summary of the entire presentation. Or, a dashboard presentation slide can be used in meetings and conferences to list down important talking points, with relevant datasets and statistics to drive conversations.
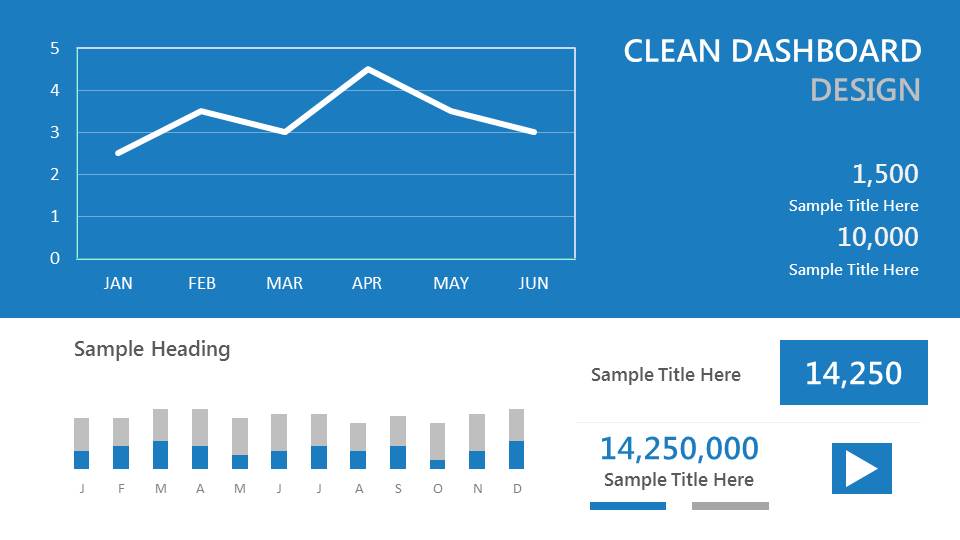
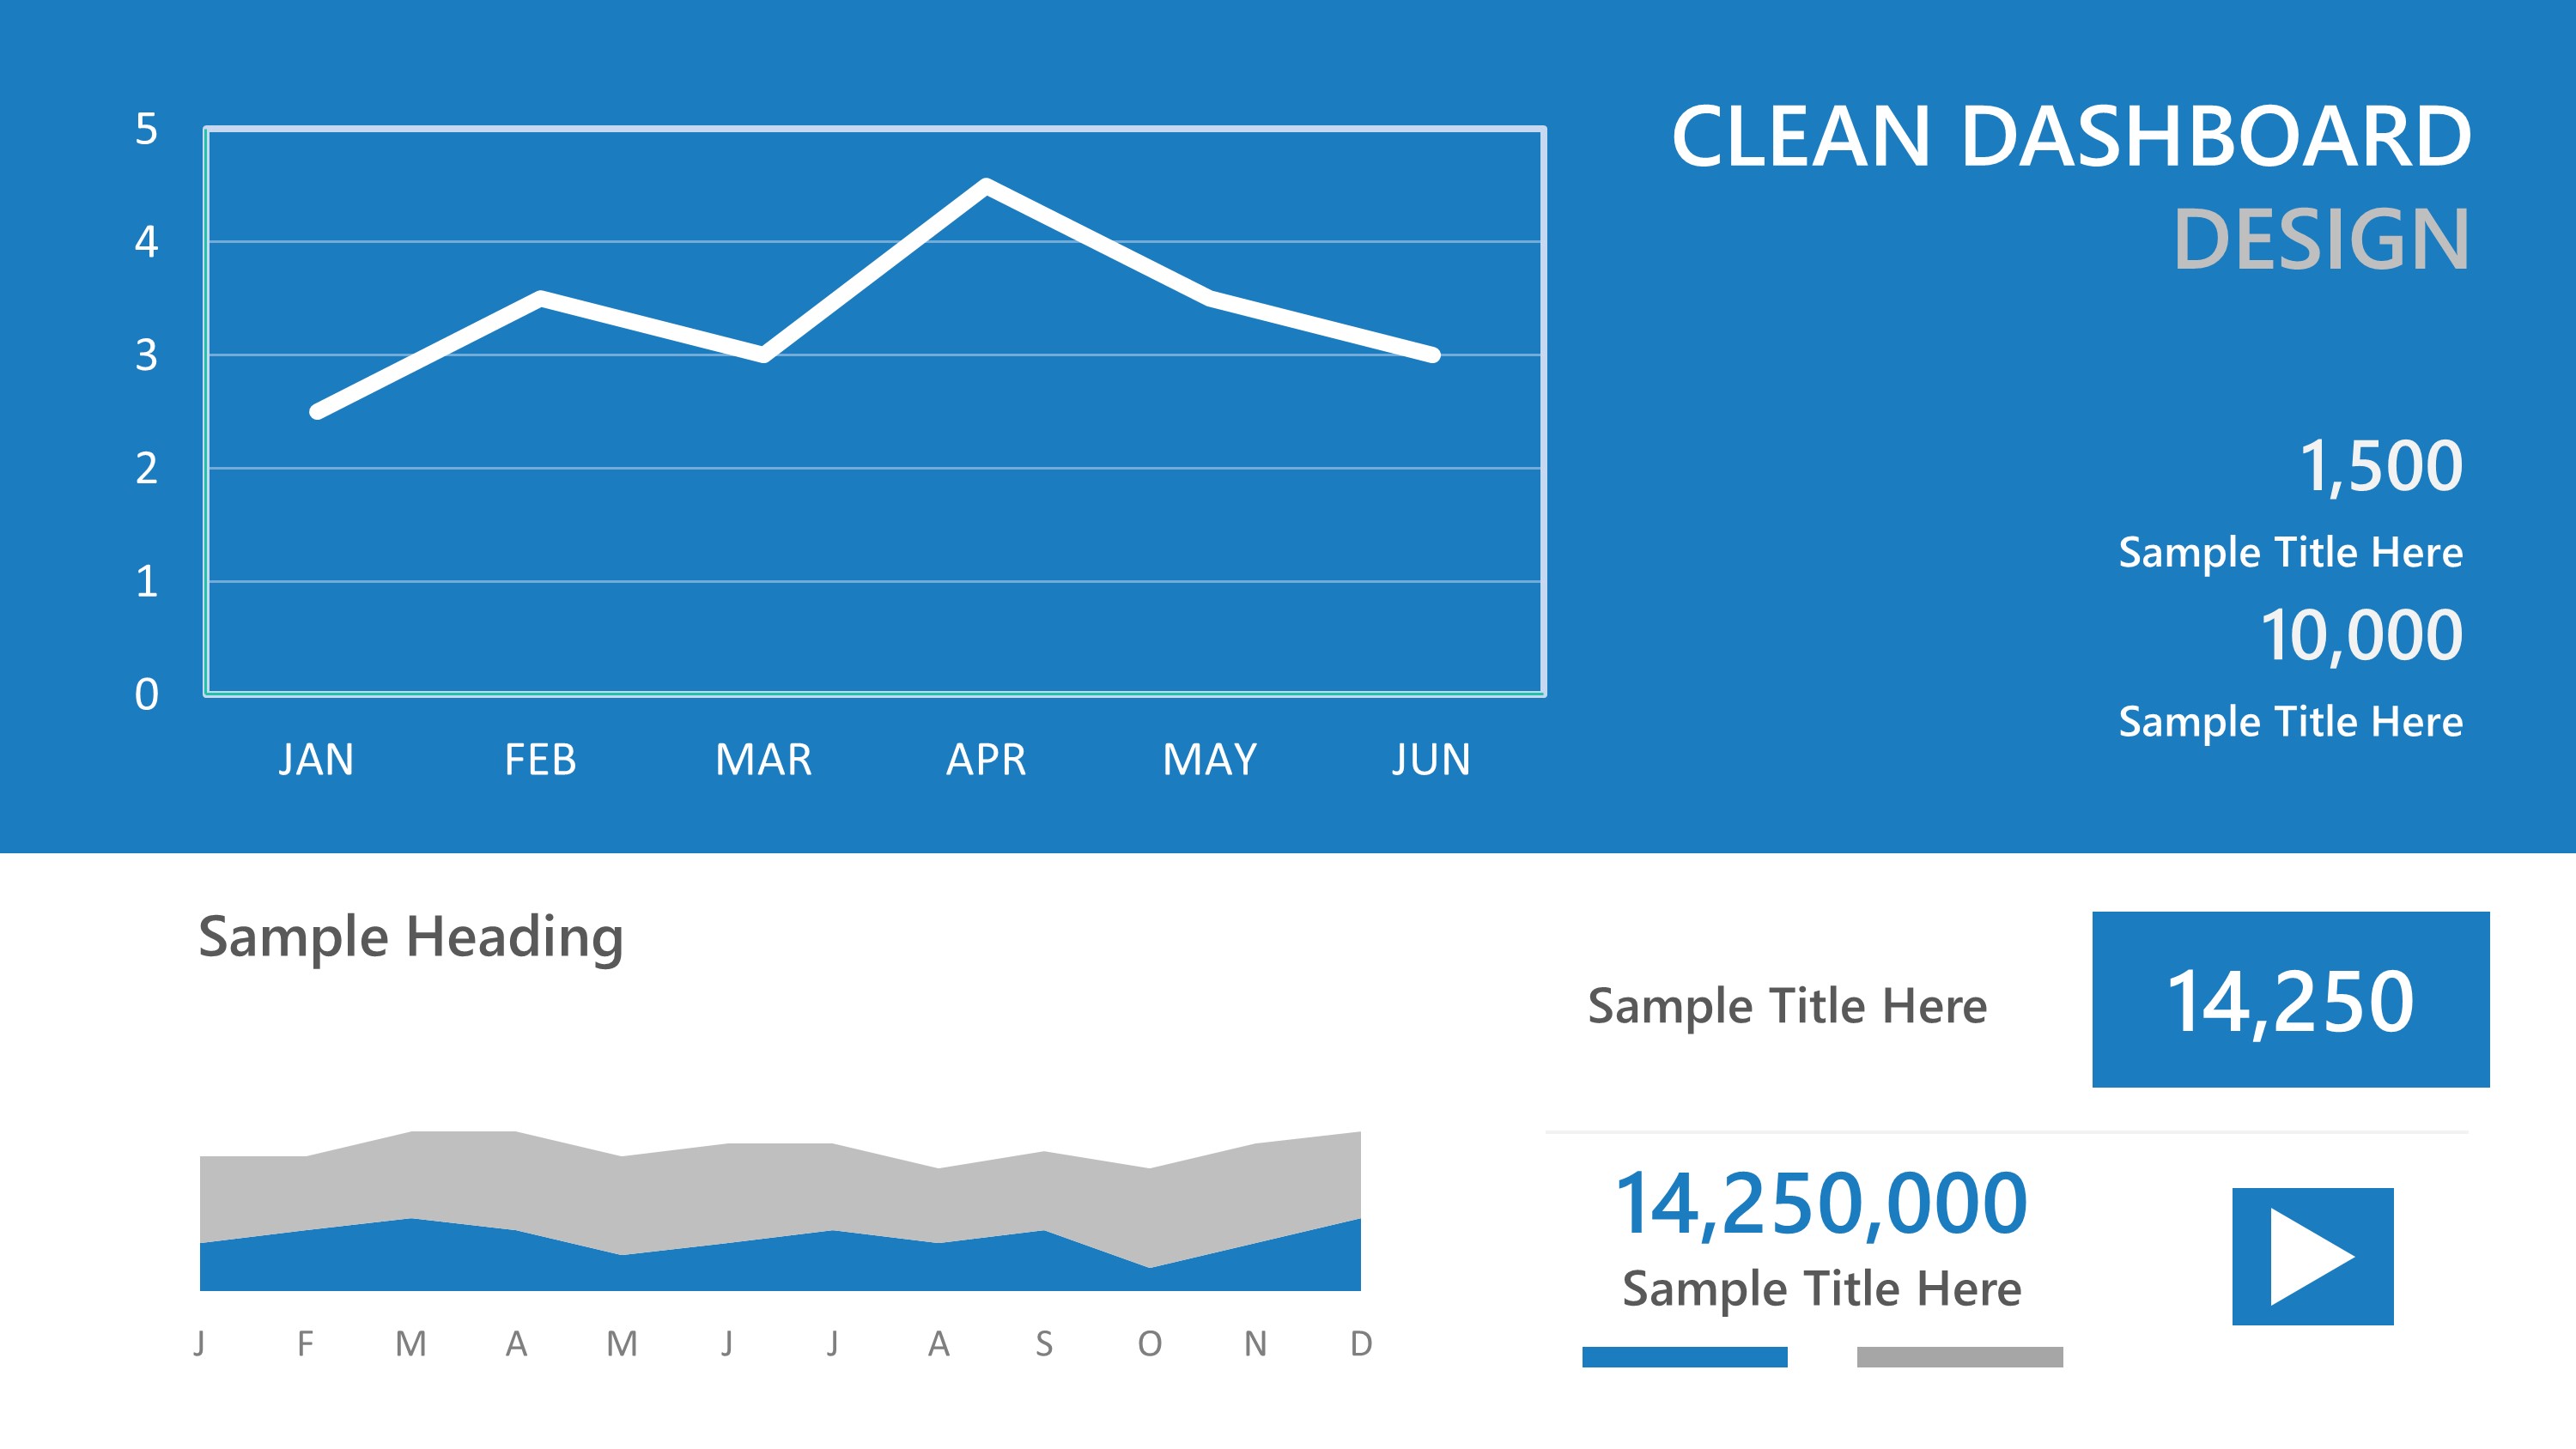
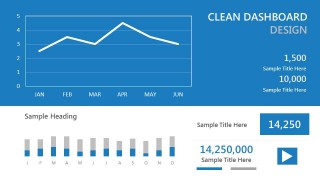
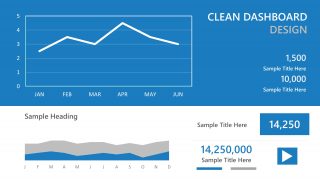
The Blue Dashboard template for PowerPoint is available in four variants, each offering a differentiating factor and can be chosen according to your priorities and information. The first dashboard contains a line graph on the right, with information on the left, whereas the second template has the information on the right with the line chart on the left. Thus, this dashboard template can be used by even the most perfectionist of professionals, for whom it is the smaller details that make a huge difference.
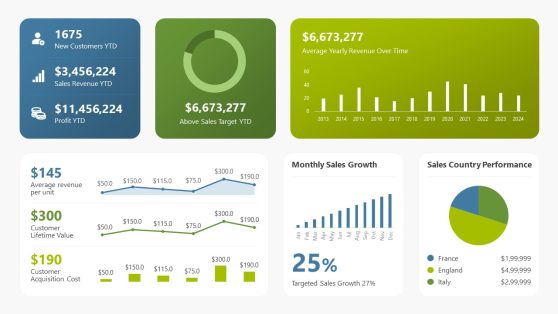
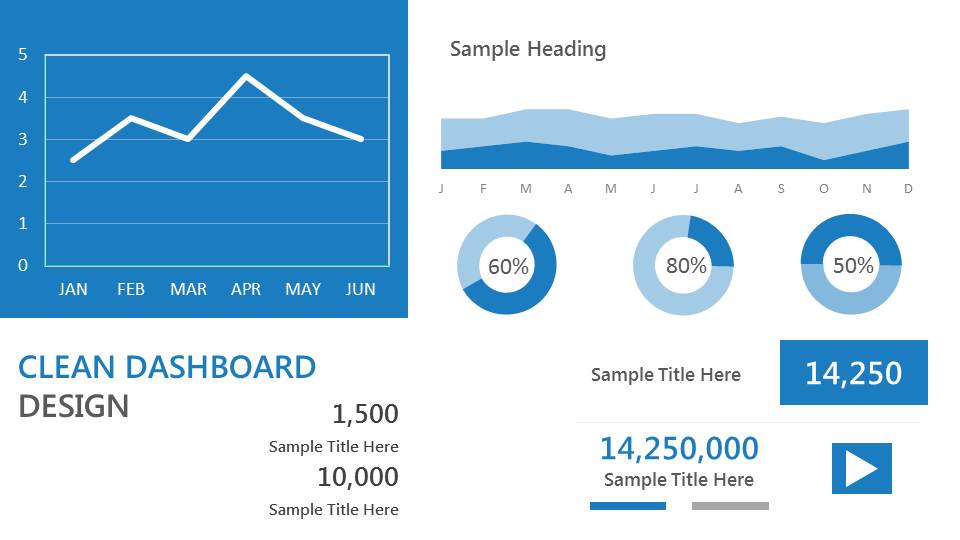
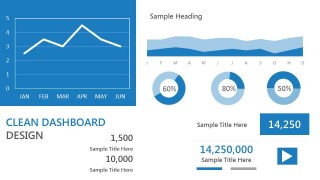
The fourth dashboard template also provides an alternate layout, wherein multiple types of data-driven charts in PowerPoint (bar chart, pie chart, area chart, etc.) can be utilised to showcase various markers of business performance, including KPIs and related indicators. Additionally, once downloaded, these presentation templates are fully editable, and can support additional charts, text and visuals in order to better cater to your specific requirements.
Each dashboard follows a professional and clean colour palette, consisting of blues and whites. The styles of the data charts can be switched out to better reflect your information. Moreover, each element can be individually edited, including their colours, style, font etc, to represent any theme you need to follow in accordance to your presentation or company standards.
Inside this blue dashboard PowerPoint template you can find four slide designs with a clean dashboard style containing different components where you can place dashboard gauges, data-driven charts in PowerPoint (bar chart, pie chart, area chart, etc.) as well as other dashboard elements like KPI or indicators.
This dashboard template is supported on all versions of PowerPoint and Google Slides, and all the edits can be made from within your larger presentation, or this individual template, on PowerPoint itself. Dashboards can be some of the most useful ways of concluding your presentation or kickstarting your meetings, and using these dashboard templates can make that process much smoother and faster.
You must be logged in to download this file.
DOWNLOADDetails (4 slides)
- Category
- Data-Driven Charts
- Rating


 Loading...
- Size
- 16x9
- Item ID
- 9057-cl
- Colors
Supported Versions:
Subscribe today and get immediate
access to download our PowerPoint templates.