3D Pie & Bar Charts for PowerPoint


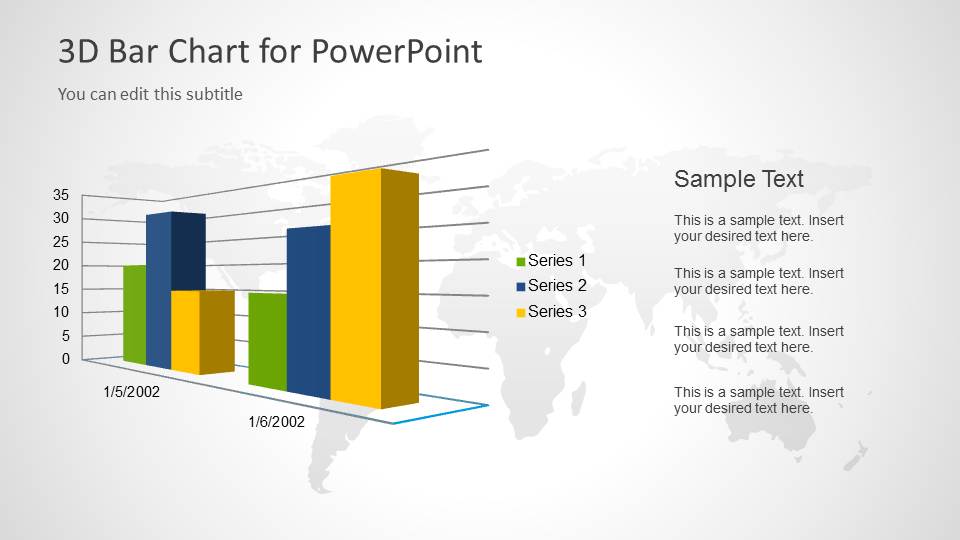
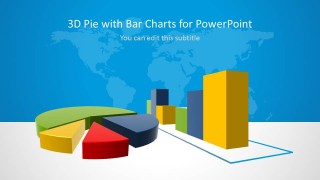

Feature company statistics with the 3D Pie and Bar Charts for PowerPoint. The solid colors and bold text make the content stand out. This is suitable for presentations where the data are highly significant to the viewers.
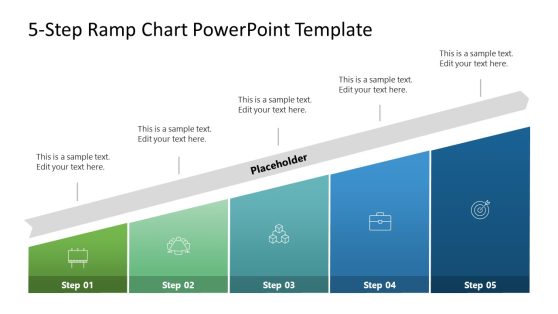
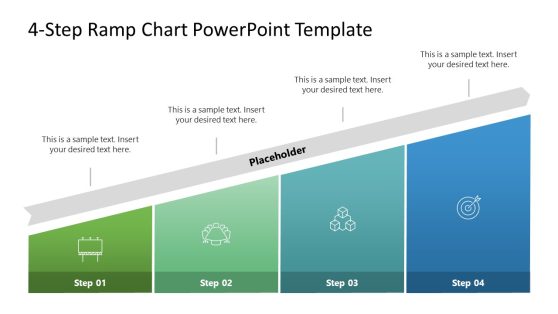
Charts provide visual representations of statistical data. The colorful graphics make the information easier to handle. In charts and graphs, data are arranged in a certain order. This feature allows analysts to identify key patterns. Through analysis, management can make changes on the business model.
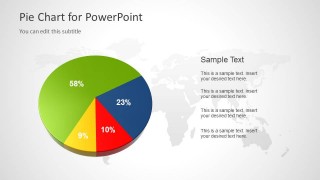
The pie and bar charts can show sales data. Other uses for the charts include demonstrating production volume and turnover. Annual statistics are best shown using the bar chart. The pie chart, on the other hand, displays percentages. For example, it can indicate employee demographic in a department. This information is relevant to human resource personnel. Using the data, they can examine the team dynamics in the workplace.
The cover slide is divided into two parts. They are colored in gray and blue, to create a horizon. A world map watermark decorates the blue upper half. The gray half acts as a platform for the main design. The design contains 3D versions of a pie chart and a bar chart. Both charts have a color scheme in yellow, blue, green, and red.
Each chart is featured against a world map background. The pie chart can be found on the left side of the second slide. The colored pie segments have text placeholders. These contain percentages for each segment. The third slide includes the bar chart at a certain angle. The bars are grouped together to show three elements in a single period. A legend is located between the chart and a text placeholder.
The 3D Pie and Bar Charts for PowerPoint are ideal for progress reports. Other variants of the bar chart are downloadable from the Gallery. The statistics help establish the reliability of the report.
You must be logged in to download this file.
DOWNLOADDetails (3 slides)
- Category
- Data-Driven Charts
- Rating


 Loading...
- Size
- 16x9
- Item ID
- 6096-01
- Colors
Supported Versions:
Subscribe today and get immediate
access to download our PowerPoint templates.